by
Tyrone Genade
Thesis presented in partial fulfillment of the requirements for the degree of Masters of Science (Biochemistry) at the University of Stellenbosch
Study leader: Prof. P. Swart
Co-study leader:
Prof. J-H.S. Hofmeyr
Department of Biochemistry
September 2003
| ---------- | ---------- |
| Signature | Date |
|
Without the help of the following people this project would never have come to fruition. The people whom I wish to thank are:
Prof. P. Swart whose insight, guidance, support and tolerance made this work possible.
Prof. J-H.S. Hofmeyr for sharing his modeling brilliance and introducing me to LATEX.
Dr. A. Swart for helping with the molecular biology work and other helpful advice.
Ms R. Louw for her help and for maintaining a functional laboratory environment in spite of the tremendous entropy generated by the students.
Prof. D. Bellstedt for the use of his heat sealer, and his assistant Coral de Villiers for help with the centrifuges.
Mr Tiedt, Mr Rehder and Ms Immelman for technical assistance. Mr K. Botha for his help in collecting ovine adrenals and countless other smaller tasks. Mr Burns and the Physics workshop for the speedy preparation of the tissue culture dish slices.
Norbert Kolar and Christie Malherbe for their positive work ethic and the example they set. Nic Lombard, Hannes Slabbert, Natasja Brown, Zyno Allie, David Richfield, Selvan Govender and Wesley Williams for all the help. Michael Vismer for helping me puzzle out problems with LATEX.
The University of Stellenbosch for assorted mercies.
Cornelia Malherbe and Uni-Ed for the work that kept my bank account out of the red.
My parents, family and friends for their encouragement and support.
pCMVc17a ¯ 3b-hydroxysteroid dehydrogenase/\triangle5-\triangle4 isomerase
ACTH Adrenocorticotrophic hormone
3bHSD 3b-hydroxysteroid dehydrogenase/\triangle5-\triangle4 isomerase
BCA Bicinchoninic acid
BSA Bovine serum albumin
CPM Counts per minute
CPR Cytochrome P450 reductase
CYP11A1 Cytochrome P450 side-chain cleavage
CYP11B1 Cytochrome P450 11b-hydroxylase
CYP11B2 Cytochrome P450 aldosterone synthase
CYP17 Cytochrome P450 17a-hydroxylase/17-20 lyase
CYP19 P450 aromatase
CYP21 Cytochrome P450 21-hydroxylase
DTT Dithiothreitol
DHEA Dehydroepiandrosterone
DMEM Dulbecco's modified Eagles medium
DMSO Dimethyl sulfoxide
DOC Deoxycorticosterone
EDTA Ethylenediaminetetraacetic acid
EtAct Ethyl acetate
FCS Fetal Calf Serum
HEPES
N-2-Hydroxyethylpiperazine-N'-2-ethanesulphonic
acid
HPLC High-performance liquid chromatography
LB Luria-Bertani
MeOH Methanol
OD Optical density
17OHP4 17-hydroxy-progesterone
P4 Progesterone
PBS Phosphate buffered saline
PenStrep Penicillin-streptomycin
rpm Revolutions per minute
S Deoxycortisol
TLC Thin layer chromatography
TRIS Tris(hydroxymethyl)aminomethane
Steroid hormones, present in the correct concentrations and ratios to one another, are vital to the survival of vertebrates [1,2]. These hormones have wide ranging activities involving the development and the maintenance of homeostasis of the animal.
The sex steroids orchestrate the differentiation of the sexes from embryological development and later regulate sexual maturation and reproductive functions. The glucocorticoids regulate the energy metabolism of the organism as well as enabling the animal to cope with stressful stimuli. The mineralocorticoids regulate the mineral and water balance of the organism.
The adrenal gland and gonads are the two major sources of steroid hormones [1]-with the brain emerging as a third important source [3]. The lack of understanding regarding the intricate regulation and control of steroidogenesis impairs our understanding of the stress response and the side effects observed with prolonged periods of stress (that cause hypertension); as well as inborn errors such as Congenital Adrenal Hyperplasia (CAH) [1].
The adrenal gland lies just above the kidney and occurs in fish, reptiles, birds and mammals [2]. It consists of two main parts: the outer cortex and the inner medulla [4]. The medulla secretes epinephrine and norepinephrine that are of great importance in the sympathetic and parasympathetic nervous system [1]. The cortex supplies the organism with the steroid hormones that regulate osmoregulation (mineralocorticoids) and metabolism (glucocorticoids); and maintain neurochemical balance and anatomical features (dehydroepiandrosterone, DHEA) [1].
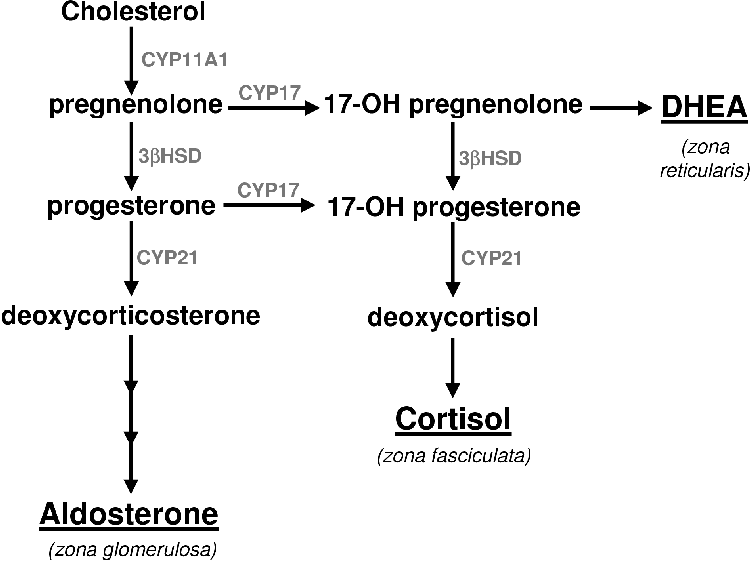
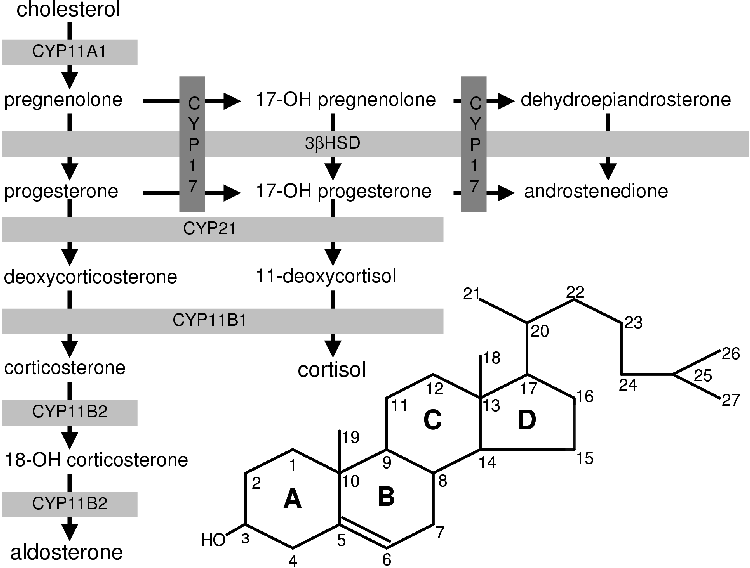
All steroids are derived from cholesterol [1]. Very little of the body's cholesterol is synthesized de novo [5]. Most of the cholesterol is obtained from the diet [5]. Cholesterol is converted to pregnenolone (P5) by cytochrome P450 cholesterol side chain cleavage (CYP11A1). P5 is the precursor of all the other steroids and stands at the first branch point in the adrenal steroidogenic network (Figure 1.1).
From P5 mineralocorticoids are synthesized in the adrenal cortex zona glomerulosa (Figure 1.1). Glucocorticoids are produced in the zona fasiculata from P5 via progesterone (P4) and 17a-hydroxy progesterone (17OHP4) [1,4,6,7]. The DHEA branch begins at P5, which is converted to 17a-hydroxy-pregnenolone (17OHP5) that is in turn converted to DHEA.
Defects in the steroidogenic network can have serious consequences. Hypoandrenocorticism results from a shortage of cortisol. The animal cannot respond to stressful stimuli and may perish. Angora goats display this steroidogenic aberration [8] and are unable to respond to challenges of low temperature or other stress. In man steroidogenic defects can cause congenital adrenal hyperplasia (CAH) [1,7]. This condition may cause symptoms ranging from mild acne and salt wasting to virilization, depending on the nature of the genetic mutation.
In hypoandrenocorticism and CAH the error involves the two enzymes cytochrome P450 17a-hydroxylase/17-20 lyase (CYP17) and cytochrome P450 21-hydroxylase (CYP21) respectively. In the case of hypoandrenocorticism in the angora goat an error has been found in the CYP17 gene that is hypothesized to result in less cortisol being produced when needed [8,9] but leaving mineralocorticoid supply unaffected. In CAH there is an error in CYP21 that results in inefficient glucocorticoid and/or mineralocorticoid production. Because of a lack of the glucocorticoids and mineralocorticoids the brain signals the adrenal gland with adrenocorticotrophic hormone (ACTH) to produce more of the deficient steroids [1,7]. Consequently, there is an over production of P5 that in turn leads to an over production of DHEA, which is converted to androgens and estrogens outside of the adrenal gland due to the DHEA in circulation diffusing into other steroidogenic tissues with the appropriate activities [1].
These defects in adrenal steroidogenesis lie in the kinetic characters of the respective enzymes. Many CYP21 mutations have been identified in patients with CAH [7]. These mutations either increase the Km or decrease the Vmax. Defects in 3b-hydroxy steroid dehydrogenase cause 5 to 10% of the CAH cases, 90 to 95% of the cases are caused by CYP21 mutations [1,7]. Likewise, mutations have been identified in CYP17 that reduce both androgen and glucocorticoid production; as well as mutations which only affect androgen production [1,10,11].
From the above it is clear that a change in the activity of CYP17 and/or CYP21 causes a change in the ratio of the adrenal steroids. This raises the question of the degree of control CYP17 and CYP21 possess over the steroidogenic network.
Control is distinct from regulation [12]. Metabolic regulation is homeostasis (the maintenance of constant conditions in response to external perturbations) and is defined in terms of the performance of the system as a unit. It is measured as co-response, Wpy1,y2 where p is the perturbed parameter and y1 and y2 the steady-state variables that change in accordance to the perturbation of p. Control (Cpy) is defined as the degree of influence a parameter has on the state of a metabolic system. For example, adrenocorticotrophic hormone (ACTH) regulates adrenal steroidogenesis by perturbing one or many parameters in the system but does not exercise any direct control over the flux or metabolite concentrations in the steroidogenic network. It is the various enzymes and transport proteins in the steroidogenic system that exert control over the distribution of metabolites. Metabolite concentrations are regulated by controlling metabolic rates.
This thesis is about control, not regulation. The question is thus: what degree of control does CYP17 and CYP21 have over the steroidogenic system?
It was previously held that the flux through a metabolic pathway can only be controlled by one enzyme-the rate-limiting enzyme [12]. In steroidogenesis all the control is hypothesized to lie with the activity of steroidogenic acute regulatory (StAR) protein or CYP11A1 [13] depending whether you regard steroidogensis to begin at the transport of cholesterol into the cell/mitochondria or synthesis of P5 by CYP11A1 .
Control Analysis [12] has shown that the control over a pathway can be distributed among all the members of the pathway. As a consequence even large changes in Km or Vmax of certain enzymes may have only a small effect on the flux through a pathway. The degree to which a particular enzyme exercises control over the flux through a pathway or network is referred to as the flux control coefficient, CpJ. Concentration control coefficients, Cps, relate the control an enzyme's activity has over the metabolite concentrations in the pathway. Such coefficients can be calculated through experimentation. Where experimentation is not possible, due to an inability to isolate the relevant enzymes or manipulate them, mathematical models based on kinetic parameters can be used to calculate the control coefficients.
Structural and Control Analysis using matrix algebra [14] are used to reduce the complexity of the pathway, network or system into mathematically malleable terms. Using such methods it is possible to determine which enzymes or sections of a pathway, network or system will have control and which will not without knowing detailed information about the components of the pathway [12,15]. Insight into the system can be obtained from this methodology. If detailed information and experimental data is available this methodology can be used to calculate the control and regulatory coefficients.
For a model, reliable and accurate kinetic data is required. One needs to have studied the pathway and accounted for all the interactions between the enzymes and substrates. One also needs an experimental setup capable of testing the model's predictions.
In cytochrome P450 research two methods of experimentation have been primarily used. These are microsomal and tissue culture studies.
Microsomal suspensions and specific enzyme inhibitors can be used to perform experiments to profile adrenal steroidogenesis. As a tool, this method has shortcomings. Both CYP17 and CYP21 as well as 3bHSD are present in the microsomal preparations at unknown concentrations. It is therefore not possible to ascertain the relative importance of each individual enzyme species on adrenal steroidogenesis.
Another problem is that the suspension no longer represents the natural state of the adrenal gland and loses the anatomical features of the steroidogenic network. As was briefly explained above (and will be further explained in Chapter 2) that the adrenal gland is composed of two distinct tissue types, the cortex and medulla [1,4]. The cortex is then further subdivided into three zones: the zona glomerulosa, the zona fasiculata and the zona reticularis. Each of these zones performs a different steroidogenic function. In the preparation of the microsomal suspension, not only is the structure lost and the different tissue enzyme concentrations pooled, but a host of undefined enzymes unrelated to mineralo- and glucocorticoid synthesis are also isolated making controlled study difficult.
Tissue culture using nonsteroidogenic cell lines has been extensively used in the study of steroidogenesis, but the transfection techniques allow for only one steroidogenic enzyme to be expressed with any control. Co-transfections are notoriously unreliable. P. Swart (pers comm.) has observed that during co-transfections the cells can only assimilate a finite quantity of plasmid and no control exists as to how much of each plasmid is assimilated. F. Bauer (pers comm.) reports that the genes in plasmids also do not behave like normal eukaryote genes nor does one plasmid behave like another. Hence, it is not possible to perform controlled experiments using traditional transfection and tissue culture techniques.
The parallel transfection method [6] allows for the separate transfection of cell lines with relevant steroidogenic enzymes (see A.4.6) and recombination for experimental purposes according to desired ratios. This technique allows the experimenter to manipulate the amount of enzyme in a defined environment in a controlled manner eliminating the worry of random plasmid assimilation and different plasmid behavior.
In the case of the bovine pCMVc17 and pCMVc21y401 plasmids it is known how each plasmid behaves in the COS1 cell line and that this behaviour is repeatable over many experiments. Controlled changes can be made to the activity of each enzyme as there is a direct correlation between the number of transfected cells and enzyme activity [6].
With a reliable experimental system and mathematical framework meaningful questions can now be asked. These questions are:
A model of the CYP17/CYP21 steroidogenic branch point was simultaneously constructed and tested using Parallel transfection techniques. COS1 cells and the well characterized bovine pCMVc17 and pCMVc21y401 plasmids were used for the transfections.
Chapter 2 reviews the role and metabolism of the adrenal steroids and discusses the regulation of steroidogenesis in relation to the anatomy of the gland. In Chapter 3 the biochemistry of the P450s is discussed and the enzymes CYP17 and CYP21 are briefly reviewed. Chapters 4 and 5 discuss the construction of the computer model, testing, application and analysis thereof. In Chapter 6 the insights from the model are tentatively applied to the physiological state and further research prospects proposed. Appendix A details the methods employed in the experiments reported in this thesis.
In this chapter the physiological role of steroids will be discussed with emphasis on the glucocorticoids and mineralocorticoids. A brief mention will be given to the role of the sex steroids (androgens and estrogens) along with information regarding their metabolism.
As mentioned earlier, steroids are hormones that can be classed into three groups: glucocorticoids, mineralocorticoids and androgens [1]. The glucocorticoids are concerned with stress response and metabolic homeostasis with regard to energy supply and demand [1]. The mineralocorticoids are responsible for salt balance and proper kidney function [1]. Androgens and estrogens are implicated in the maintenance of secondary sex characteristics, regulation of the reproduction cycle and over all health and healing [16].
Recent evidence indicates that DHEA and its derivatives are involved in brain chemistry [17,18,19]. Androstenedione, testosterone and estradiol are implicated in the regulation of anabolism [1]. The main sources of androgens are the gonads [1,20] with small amounts of precursor (DHEA and androstenedione) synthesized by the adrenal gland [1,16,21] and brain [18,19]. The type of androgen synthesized in the adrenal is dependent on the species. Rodents do not synthesize any androgens nor cortisol in the adrenal gland [16,22,23,24]. Estrogens can be synthesized in the plascenta, adipose tissue, fibroblasts, brain, osteoblasts, macrophages and fetal tissues [25].
The glucocorticoids and mineralocorticoids are produced in the adrenal cortex [1,26] with trace amounts in the skin [27].
The steroids classed as glucocorticoids are: deoxycortisol (S), cortisol and corticosterone. The main roles of the glucocorticoids are maintenance of metabolic homeostasis; and eliciting the body's stress response [1,16,26]. They serve to regulate carbohydrate, protein and fat metabolism and osmotic balance, mediating the excretion of water from the body. A lack of glucocorticoids can result in collapse and death from exposure to even minor noxious stimuli or water intoxication [1]. It is interesting to note that a small amount of steroid can correct for such a shortage.
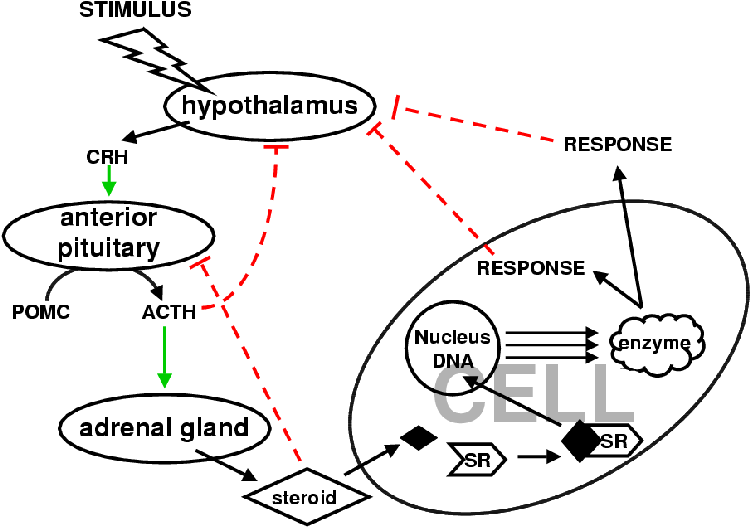
Steroids are amphipathic and easily diffuse through the plasma membranes of cells [1,26]. In target cells they bind to a receptor (see Figure 2.1), the glucocorticoid receptor (GR), that then dimerizes and recruits transcription factors. The GR binds to specific DNA sequences and initiates the expression of homeostaticly strategic genes. The products of these genes correct the homeostatic imbalances that then signals the brain to cease the stimulation of glucocorticoid production.
The normal response to stress is an increase in glycogenesis and gluconeogenesis through the upregulation of phosphoenol pyruvate carboxylase, fructose-1,6-bisphosphatase, glucose-6-phosphatase and glycogen synthase [1,26]. In peripheral tissues glucocorticoids have an anti-insulin effect that can aggravate diabetes. Here they inhibit protein synthesis and increase protein catabolism [26] and have a permissive action: allow glucagon and catecholamines to exert their calorigenic effects. In addition they increase ketone body formation and plasma lipid levels. Glucocorticoids serve to regulate the osmotic balance and prevent water intoxication by stimulating the excretion of sodium ions.
Glucocorticoids and ACTH regulate their own production via a negative feedback loop preventing the secretion of ACTH [1] (Figure 2.1).
Glucocorticoids are critical for vascular reactivity and are implicated in nervous problems [1]. A lack of glucocorticoids can cause irritability, apprehension and an inability to concentrate reminiscent of alcohol intoxication.
Cortisol specifically inhibits lymphocytes, eosinophils and basophils by inhibiting mitosis, DNA replication, antibody production and interleukin-2 (IL-2) secretion. Glucocorticoids have been observed to stimulate the apoptosis of T-lymphocytes stunting the immune system. They also reduce the severity of allergic and inflammatory responses. Fibroblast growth is inhibited slowing wound and broken bone healing [1,26]. Excess use of glucocorticoids as a medication can cause bone degradation.
Stress causes an increase in ACTH and glucocorticoid levels. The increase in plasma glucocorticoid levels reach pharmacologic levels (from a basal 3.8 nM to 14 nM) that are life-saving in the short term but are harmful and disruptive in the long term. This increase relative to the levels of mineralocorticoid is not well understood [1] and is one of the questions the work reported in this thesis attempts to clarify.
There are three steroids that exert a mineralocorticoid effect. These are, in order of decreasing efficacy: aldosterone, corticosterone and deoxycorticosterone (DOC) [1,26]. These hormones are involved in the retention and absorption of sodium from the extracellular fluid (urine, sweat, saliva and gastic juices). They affect the epithelial cells of the cortical collecting ducts in the kidney where it acts to increase sodium absorption and potassium and proton excretion. The opposite is caused in the brain and muscle tissues where they promote sodium excretion and potassium retention.
The method of action of the mineralocorticoids is similar to that of the glucocorticoids mentioned above [1]. Their affect can occur within 10 to 30 minutes; but they also have a faster nongenomic effect. Mineralocorticoids directly inhibit the amiloride-inhibitable sodium channels in the apical membrane, presumably via the inositol-triphosphate signaling pathway [1]. They increase the activity of the sodium-potassium exchange via increased expression of the sodium-potassium ATPase. A loss of mineralocorticoids can result in hypotension and circulatory problems that can lead to fatal shock.
The mineralocorticoid response element (MR) is more sensitive to glucocorticoids than mineralocorticoids (see Table 2.1). This problem is solved by the MR sensitive tissues expressing type 2 11b-hydroxysteroid dehydrogenase that converts cortisol to cortisone and corticosterone to 11-oxy-corticosterone [1].
| Steroid .. | Glucocorticoid activity | Mineralocorticoid activity | ||
| Cortisol | 1 | .0 | 1 | .0 |
| Corticosterone | 0 | .3 | 15 | . |
| Aldosterone | 0 | .3 | 3000 | . |
| DOC | 0 | .2 | 100 | . |
| Cortisone | 0 | .7 | 1 | .0 |
| Prednisolone | 4 | . | 0 | .8 |
| 9a-Fluorocortisol | 10 | . | 125 | . |
| Dexamethasone | 25 | . | ~ 0 | . |
Steroid metabolism in the adrenal gland is composed of a complicated network of reactions. An understanding of the steroidogenic network is crucial to the comprehension of the information presented in this and later chapters.
Using cholesterol metabolism (Figure 2.2) as a starting point, steroid metabolism (Figure 2.3) will be discussed.
Steroids are synthesized in the gonads, brain, adrenal cortex, skin and placenta [20,22,25,27,28]. They are metabolized by cytochrome P450 enzymes in the endoplasmic reticulum and mitochondria. The endoplasmic reticulum (ER) P450s are linked to cytochrome P450 reductase (CPR, see section 3.1.2) that supplies the electrons for the oxidation of the steroids. In the mitochondria the electrons are derived from the mitochondrial membrane electron transport system.
Steroid metabolism is highly compartmentalized [5]. This feature will be dealt with in section 2.3.
Cholesterol is the precursor of all steroids [1]. Cholesterol is synthesized de novo from acetate but is primarily imported into the adrenal cells as low density lipoprotein (LDL) [1,5].
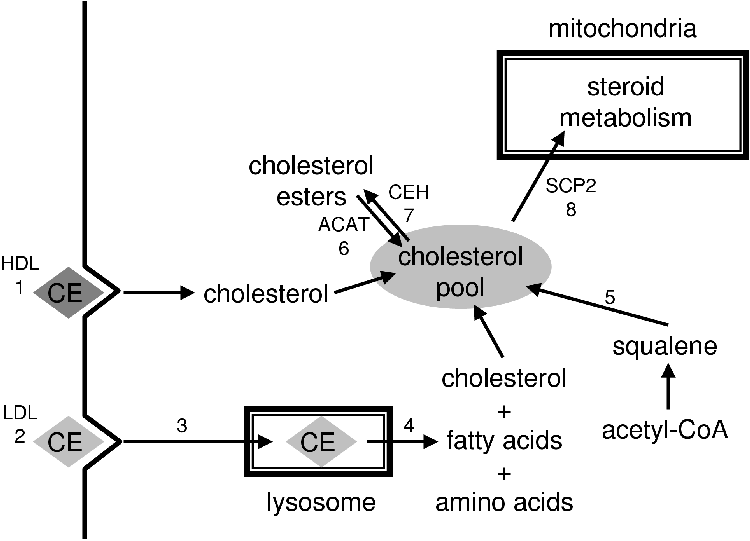
LDL receptors are especially abundant in the adrenocortical cells of the adrenal cortex [5]. The LDL that is taken up (reaction 2, Figure 2.2) is ferried across the membrane of the lysosome by cholesterol ester transfer protein (CETP), the cholesterol is then esterfied by acetyl-CoA:cholesterol acyltransferase (ACAT) (reaction 6, Figure 2.2) and stored in lipid droplets in the cell [20,29]. Cholesterol ester hydrolase catalyzes the release of cholesterol (reaction 7, Figure 2.2) in lipid droplets. The free cholesterol is transported to the mitochondria by the sterol carrier protein 2 (SCP2) and across the mitochondrial membranes by steroidogenic acute regulatory protein (StAR), a protein of 32 to 37 kDa [13,30].
StAR is hypothesized to facilitate the contact points between the outer and inner mitochondrial membrane that allows cholesterol to diffuse to cytochrome P450 side chain cleavage (CYP11A1) that metabolizes it to P5 [1,5,13,30].
P5 stands at the first branch in the adrenal steroidogenic pathway. If metabolized by 17a-steroid hydroxylase (CYP17) it can be committed to androgen biosynthesis (see Figure 2.3) [1]. If it is metabolized by 3b-hydroxy-steroid dehydrogenase isomerase (3bHSD) to yield progesterone (P4) and one molecule of NADH it is committed to corticoid biosynthesis. It is at P4 that the next branch in the steroidogenic pathway occurs [1]. This branching leads to either mineralocorticoid or glucocorticoid biosynthesis.
Aldosterone is the endpoint of the mineralocorticoid branch of steroidogenesis. The steroid 21-hydroxylase (CYP21) converts P4 to DOC in the ER. The DOC then diffuses back into the mitochondria where it is metabolized to corticosterone via 11b-hydroxylase (CYP11B1). Corticosterone is converted to aldosterone in a two step process whereby it is oxidized at position 18 in a process carried out by the same enzyme: aldosterone synthase (CYP11B2) [1,3]. The bovine CYP11B1 is capable of the same activities of CYP11B2 and hence lacks this enzyme [6].
Aldosterone diffuses freely out of the mitochondria and the cell into the blood stream where it, and other steroids, are bound and transported by steroid hormone binding globulins (SHBG) [1].
For cortisol biosynthesis, P4 is converted to 17-hydroxy-progesterone (17OHP4) by 17a-steroid hydroxylase (CYP17). The 17OHP4 is converted to S by CYP21. The S diffuses into the mitochondria where it is metabolized to cortisol by CYP11B1
Cortisol is further metabolized to cortisone by type 2 11b-hydroxysteroid dehydrogenase (11bHSD) in the liver. In the liver it is reduced and conjugated to form tetrahydrocortisone glucuronide and excreted into the urine in the kidneys [1]. While type 1 11bHSD can convert cortisol to cortisone and vice versa using NADH as electron carrier, type 2 11bHSD can only metabolize in the direction of cortisol to cortisone. About 10% of the cortisol is converted to 17-keto-steroid in the liver. These are conjugated to sulphate and excreted. 20-hydroxy derivatives are also formed.
Corticosterone is metabolized similarly to cortisol except that no 17-keto derivatives are formed [1].
Sex steroid synthesis begins with the conversion of pregnenolone to 17-hydroxy-pregnenolone (17OHP5) via 17a-steroid hydroxylase (CYP17). 17OHP5 is converted to DHEA via the 17,20-lyase activity of CYP17; or 17OHP5 can be converted to 17OHP4 via 3bHSD and proceed to S or androstenedione. DHEA can be converted to androstenedione by 3bHSD or sulphonated by adrenal sulfokinase to form DHEA-sulphate-the primary form of DHEA secreted from the adrenal. In the adrenal gland of many animals androgen synthesis stops at DHEA or androstenedione. In small mammals it does not occur at all [16,22,23,24].
DHEA and androstenedione can be converted to testosterone and estrogens in the circulation by diffusing into other steroidogenic tissues; and are an important source of sex steroids in men and postmenopausal women [1].
Androstenedione can be metabolized reversibly to testosterone in a reaction catalyzed by 17b-hydroxysteroid dehydrogenase [1,20]. Testosterone can be metabolized to dihydrotestosterone by 5a-reductase in the gonads, brain and placenta. Aromatase (CYP19) can metabolize testosterone to 17b-estradiol or form estrone directly from androstenedione. Estrone can be converted to 17b-estradiol in a reversible reaction catalyzed by 17b-hydroxysteroid dehydrogenase.
In the human adrenal gland, DHEA is the major androgen synthesized [1,3,10,21,24].
The presence of CYP17 17,20-lyase activity depends on the ratio of CPR to CYP17 and other factors (see section 2.3). In the presence of high enough concentrations of CPR the reaction from pregnenolone to DHEA is alleged to occur in one step [24] with very little 17OHP5 being released. Other reports clearly show 17OHP5 [24,31,32].
Different species also favour different substrates for the 17,20-lyase reactions. Larger mammals favour the P5 route [16,23,24] while in smaller mammals, such as the rat, all CYP17 activity is restricted to the brain and gonads and equal favour is given to P5 and P4 routes.
In man there are two more reactions catalyzed by CYP17. CYP17 can hydroxylate P4 at C16 to form 16a-hydroxy P4 (16OHP4) [32]. The ratio of 17OHP4 to 16OHP4 was found to be 4:1 in COS1 cell transfection studies with pcD17aH; and 3.5:1 in fetal adrenal microsome incubations with P4. No 16-hydroxy P5 was observed. The physiololgical role of the 16OHP4 is not yet known.
The anatomy of the adrenal gland is a governing feature of adrenal steroidogenesis. From tissue organization and enzyme expression patterns it is evident that the adrenal gland is a complicated and intricately regulated organ composed of dynamic tissue types. The anatomy and regulation of steroidogenesis in the adrenal gland will be discussed in the following sections.
The adrenal cortex is divided into three distinct zones from capsule to medulla: the zona glomerulosa, fasciculata and reticularis (Figure 2.4) [4].
In man the zona glomerulosa constitutes 15% of the adrenal cortex volume while the zona fasiculata occupies 80%. The zona reticularis comprises 5 to 7%, but has a wider radius than the zona glomerulosa and zona fasiculata and thus appears to be larger. The zona glomerulosa is a tightly packed collection of ovoid clusters and curved columns that are continuous with the zona fasiculata. These cells are surrounded by a rich network of fenestrated sinusoidal capillaries. The lareg polyhedral cells of the zona fasiculata are supplied by the same fenestrated sinusoidal capillary network. The cells of the zona reticularis are smaller than those of the zona fasiculata. These cells are arranged in anastomising cords separated by fenestrated capillaries. All the cells exhibit a well-developed smooth endoplasmic reticulum and numerous mitochondria.
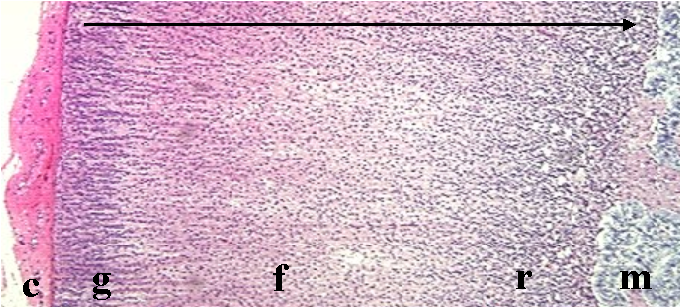
The determination of the steroid products of the adrenal cortex begins with its anatomy. The fenestrated sinusoidal capillaries flow from the capsule into the medulla. The capillaries flow through the zona glomerulosa into the zona fasiculata and then into the zona reticularis, forming a dense network. In this way, excess steroidogenic intermediates are metabolized and so do not exit the adrenal gland and upset the steroid mediated homeostasis of the animal.
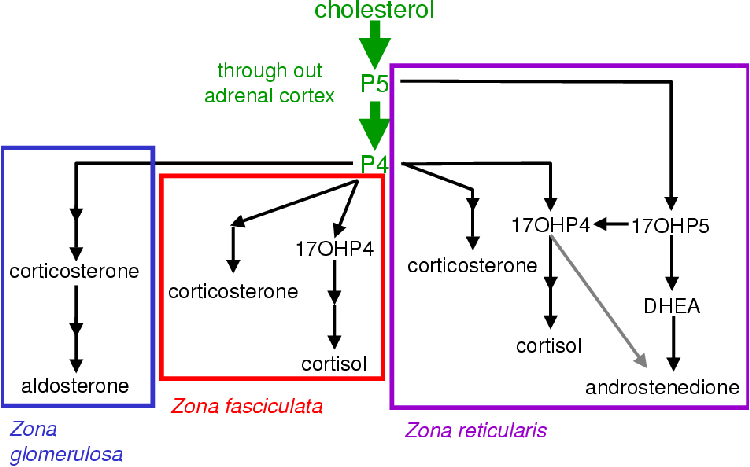
The anatomical compartmentalization allows for the biosynthesis of a range of steroids from a complicated interconnected pathway (see Figure 2.5). Aldosterone is the major product of the zona glomerulosa. The zona fasiculata produces cortisol and the zona reticularis yields androgens and small amounts of cortisol [4,22].
The size and output of the adrenals zones has been observed to change with age in the guinea pig and primate fetus [22,34]. In the guinea pig the zona reticularis is observed to increase with age with a resulting increase in activity of this region. This is associated with a decrease in the size of zona fasiculata and a concomitant decrease in cortisol output. The increase in the size of this zone is accompanied by an increase in the activity of CYP2D16 (an enzyme associated with xenobiotic metabolism) in the guinea pig [22]. This enzyme can degrade cortisol. On account of the blood flow from zona glomerulosa to zona reticularis, it is put forward that this enzyme activity may serve to modulate the adrenal hormone secretion [22].
CYP11A1 is more active in the zona fasciculata than the zona reticularis of the guinea pig. This conforms with the the observation that in small mammals androgen synthesis is restricted to the gonads [1,22].
During maturation there is a decline in the activity of CYP2D16 in female guinea pigs. It has been speculated that this is linked to the increase in free estrogens. The zona reticularis only reaches a size of 40% adrenal volume in the female compared to the male volume exceeding 50%. This indicates that the difference in male and female steroid hormone ratios are mediated as much by differential enzyme expression as by anatomical modulation and enzyme activity.
Different steroidogenic P450 expression patterns exist in the three adrenal steroidogenic tissues as shown in Table 2.2.
| zona glomerulosa | zona fasciculata | zona reticularis |
| CYP11A1 | CYP11A1 | CYP11A1 |
| CYP11B1 | CYP11B1 | CYP11B1 |
| CYP11B2 | - | - |
| CYP21 | CYP21 | CYP21 |
| CYP17 | CYP17 | CYP17 |
| 3bHSD | 3bHSD | 3bHSD |
| CPR | CPR | CPR |
| - | (CYTB5?) | CYTB5 |
Steroidogenic P450 expression is regulated in a tissue specific manner [25]. All steroidogenic P450s have an SF1 binding motif upstream of the promoter. A Nur77 binding motif is also associated with P450 expression [35]. Neither DNA binding motifs explain how expression can be regulated independently between tissue types.
The CYP21A and CYP21B alleles have an intricate promoter structure with various sites for expression regulation [35]. The CYP21A gene lies adjacent to the C4A gene that codes for the major histocompatibility complex in man and mouse, and the CYP21B gene lies adjacent to the C4B gene. The order is 5' C4A, Cyp21A, C4B, Cyp21B 3', from telomere to centromere. The Z promoter, of the CYP21 gene lies in intron 35 of the C4 gene. This Z promoter is composed of three sub-promoters: ZA, ZB and XA. They are adrenal specific and under the control of SF1 but their regulator is not yet known.
Adrenal steroidogenesis is strictly regulated by hormonal means. The two primary effectors of adrenal steroidogenesis are angiotensin II and ACTH [1]. Gonadotrophins are not involved in the regulation of adrenal steroidogenesis but rather the development of the various steroidogenic tissues. The adrenal androgen-stimulating hormone (AASH) secreted by the pituitary during adrenarche is theorized to regulate the androgen/estrogen output of the adrenal [1].
The peptide hormone, ACTH, is secreted by the anterior pituitary in response to physiological stress (e.g. having starved oneself while sleeping during the night) [1] and is the major stimulant of the adrenal cortex [22]. ACTH is a 39 amino acid polypeptide derived from a 134 amino acid precursor pro-opiomelanocortin (POMC) (see Figure 2.1). POMC is cleaved into ACTH, lipotropin (g-LPH) and b-endorphin in response to the stimulation of CRH released from the hypothalamus. Some g-melanotropin (g-MSH) is also released. The first 23 amino acids of ACTH form the active core of the molecule. ACTH serves to increase the amount of circulating glucocorticoids and androgens. ACTH binds to ACTH receptors on the cell surface of the adrenal cortical cells with high affinity where it activates an adenylate cyclase via a Gs-coupled protein. This triggers an increase in cAMP with a resultant activation of protein kinase A (PKA). PKA phosphorylates cholesterol ester hydrolase, allosterically activating it. This results in an increase in free cholesterol that is converted to pregnenolone, which then enters the steroid biosynthesis pathways.
PKA upregulates the expression of P450 enzymes CYP11B1 and CYP11A1 [1], and 3bHSD. Protein kinase C (PKC) has been shown to down-regulate the expression of these enzymes [36] and appears to be a tonic negative regulator of steroidogenesis. These effects by PKA in response to ACTH are only observed under chronic stimulation. With acute stimulation, only an increase in StAR mRNA is observed [37]. This increase in StAR mRNA cannot explain the early effects resulting from ACTH stimulation. Under acute stimulation the activity of CYP11A and CYP21 remain unchanged. The acute effects appear to be the result of the increase in free cholesterol [36]. ACTH also increases the levels of c-jun, c-fos, jun-B and fos-B. These polypeptides form part of the AP-1 transcription factor that has been shown to work synergisticly with the glucocorticoid receptors and is associated with the expression of a wide range of target genes, many of which are not associated with the cell cycle [38]. Increases in cAMP also triggers the up regulation of a 30 amino acid peptide, steroidogenesis activator polypeptide (SAP) a 3.2 kDa 30 amino acid polypeptide [1,13]. SAP stimulates CYP11A1 activity in vitro and may facilitate cholesterol transportation into the mitochondria but no mechanism has been satisfactorily demonstrated [13,39]. SAP is present in all steroidogenic tissues that have to date been investigated [13,20,39,40].
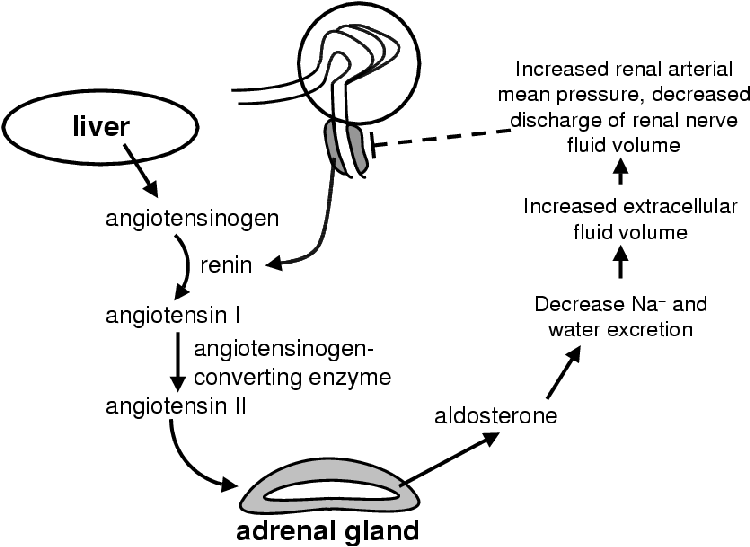
ACTH has only major effects on the zona fasiculata and zona reticularis with acute stimulation. The zona glomerulosa is under the control of the peptide angiotensin II (Figure 2.6) that binds to a specific receptor on the surface of the zona glomerulosa cells [1]. The zona glomerulosa is mildly responsive to ACTH. Angiotensin II serves to increase the amount of mineralocorticoids in circulation [27]. It is linked to a G-protein that activates PKC. In the zona glomerulosa PKC triggers an increase in the conversion of cholesterol to pregnenolone as well as deoxycorticosterone to 18-hydroxycorticosterone. Angiotensin II is produced in the liver as Angiotensin. Renin, secreted by the juxtaglomerular apparatus in the kidney in response to low blood pressure, catalyzes the conversion of angiotensinogen to angiotensin I. Angiotensin converting enzyme in the endothelial cells throughout the body convert angiotensin I to angiotensin II, which then signals for an increase in aldosterone synthesis and secretion. Aldosterone decreases sodium and water excretion that increases the blood pressure and so inhibits the release of renin completing the negative feedback loop.
Tumor necrosis factor a (TNF-a) stimulates steroidogenesis by triggering a release of ACTH [41]. TNF-a decreases the synthesis of cortisol, shifting metabolism to androgen synthesis. Glucocorticoids reciprocate by suppressing the effect of TNF-a by inhibiting the monocytes that secrete it. This feedback loop functions over a time frame dependent on the duration of the stimulus. At the onset of illness there is a release of TNF-a that results in a decrease in cortisol and increase in androgens that promote healing. The released TNF-a causes an increase in ACTH that increases cortisol levels that then in turn decreases the levels of TNF-a returning the physiology back to its original state.
Cortisol mediates a direct effect on the pituitary as well as on the hypothalamus where it inhibits corticotropin-releasing hormone that would stimulate the release of ACTH in response to stress [1].
The main allosteric effectors of the steroidogenic pathway are cytochrome b5 (CYTB5) and ATP, which is used to phosphorylate certain enzymes as explained for CEH in the previous subsection.
CYP17 has been identified as a target of allosteric regulation in the adrenal [10,24,28,42]. As the reactions catalyzed by CYP17 (see Figure 2.3) stand at critical branch points, it must be strictly regulated to avoid developmental and metabolic abnormalities. No definitive information is currently available as to the factors that limit its expression to the zona fasiculata and zona reticularis.
The switch between 17-hydroxylase to 17,20-lyase activity is mediated by CYTB5, phosphorylation and the concentration of NADPH-CPR [16,24,28,43,44,45,46]. The lyase activity is regulated independently of the 17-hydroxylase activity in an age-dependent pattern to regulate the onset of andrenarche [45,46]. This developmental regulation is only seen in man and the great apes.
While CYTB5 and CPR have been implicated experimentally in the activity of the 17,20-lyase reaction, these show no increase relative to the activities of CYP17 in situ [11,46]. The ability of CYTB5 to increase the catalysis of D4- as well as D5-steroids brings into question its role as an selective allosteric activator CYP17. Further complicating matters, CYTB5 has also been shown to increase CYP21 activity in certain species [47].
The phosphorylation of CYP17 seems to be the most reasonable explanation for the switch between 17-hydroxylase and 17,20-lyase activity [45,46].
The synthesis of steroid hormones occurs in an intricate network of reactions that are regulated at many different levels. From the data it is clear that it is the anatomy of the gland more than any other one factor that determines the end products of the steroidogenic network. Effectors such as ACTH, angiotensin, CYTB5 and the phosphorylation of certain enzymes only serve as tonic regulators of the various enzymes involved. This is not to claim that the kinetic properties of the enzymes are irrelevant, to the contrary, the kinetics of each enzyme is important. The flux through any pathway can only be as fast as the slowest reaction in the pathway. The maximal pace at which the enzymes can work is determined by their kinetic properties. These properties will be discussed in the next chapter.
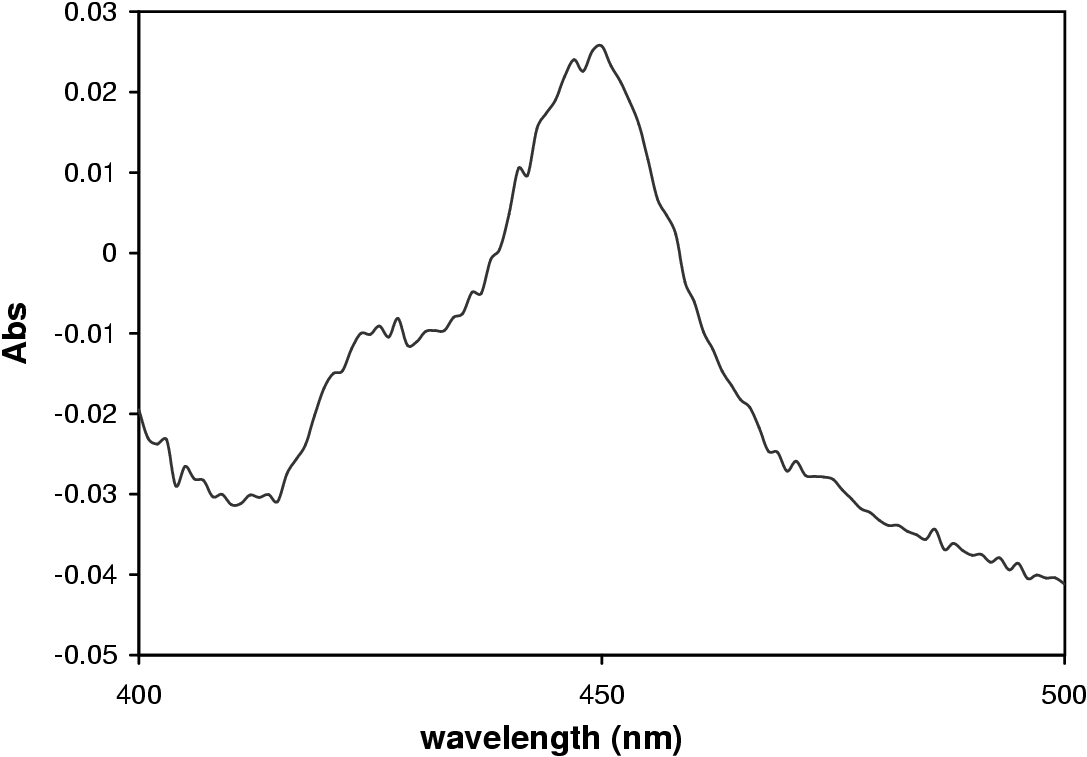
P450s are cytochromes belonging to the CYP gene superfamily [48]. These hemeoproteins are mixed-function oxidases and exhibit a peak at 450 nm upon reduction and saturation with CO (Figure 3.1) [26,49,50].
There are more that 230 distinct CYP genes and pseudogenes in 36 families of which ten have subfamilies. Of these subfamilies 26 are represented by only one gene [51]. P450s occur in a wide range of organisms, from simple bacteria to all animals and plants [49,52].
The P450 family is responsible for the metabolism of endogenous compounds such as fatty acids, sterols, prostaglandins and ketones [48,49,50,51,53]. They play an important role in the metabolism of xenobiotics and are hypothesized to play a role in redox cycling to generate reactive oxygen species in the cell [53].
Klingenberg published the discovery of a CO binding pigment in liver microsomes in 1958 [50]. Omura and Sato established that this CO binding pigment was a hemeoprotein in 1961 [50] when they observed the characteristic absorbance spectrum in the Soret region with an absorbance maximum of 450 nm after saturation with CO and reduction (Figure 3.1).
Cytochromes P450 constitute a large gene superfamily classified by amino acid sequence homology, i.e. structure rather than function [52,54]. The nomenclature of P450s can be described with reference to an example: CYP3A1. CYP is the class of protein, the three designates the family and the letter A denotes the subfamily. The last number, in this case one, identifies the type [50,54].
The structures of four bacterial P450s have been resolved. These are P450cam, P450BM3, P450terp and P450eryF [10,55]. P450cam has been solved to a resolution of 2.0 Å [10], and has been used to develop structural computer models for mammalian P450s. Animal and plant P450s are membrane-bound, and present special challenges for X-ray crystallographic analysis. The first X-ray crystallographic structures of animal and plant P450s were only published after 2000 [56,57]. In addition to the structure of CYP2C5 [56,57], the structure of CYP2B4 has been resolved to 1.6 Å resolution [58]. Comparison of CYP2C5 and CYP2B4 reveal that there can be large differences in binding site conformation without perturbing the general P450 structure [58,59]. It is hypothesized that this flexibility of conformation in xenobiotic metabolizing P450s facilitates substrate access, metabolic versatility and product dissociation. It is hypothesized that the adrenal steroidogenic P450s will have a more restrictive catalytic site due to the specificity of the reactions involved in steroidogenesis [60]. These structures were obtained by truncation of the hydrophobic N-terminal domain through mutagenesis rendering the protein more hydrophilic and easier to crystallize [56,57,58]. Without the N-terminal leader sequence anchoring the protein to the membrane, the protein still associates with the membrane suggesting that the catalytic site also interacts with the membrane [60].
At the core of the P450 is an iron protoporphyrin IX moiety. A cysteine residue in the protein forms a thiolate bond with the moiety serving as one of the two non-heme ligands for the heme iron (Fe3+) [61]. Computer models of CYP17 based on P450BM3 confirm the role of positively charged residues around the active site in holding the heme-group in position [10].
For proper P450 activity endoplasmic and mitochondrial P450s must be in contact with the membrane [10]. They are held in contact with the membrane by a hydrophobic N-terminal domain. The catalytic domain is found on the membrane surface, and enzymatic activity is associated with the C-terminal. Protein-protein interaction between the P450 and a specific redox partner is required for catalysis to proceed. In the microsomes the redox partner is CPR. CPR supplies the electrons from NADPH needed for oxygen activation. The lipid environment has been shown to play an important role in the function of P450s [62]. The extent and nature of this interaction is not fully understood.
P450s interact with N-acetyltransferases in xenobiotic metabolism [63]. The extent of the enzymatic collaboration is uncertain. In some circumstances the N-acetyltransferases metabolize P450 products, while in other circumstances, the P450s metabolize the products of the N-acetyltransferases.
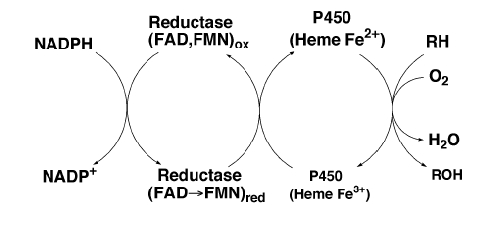
All P450s are the terminal electron acceptors in a short electron transport chain (Figure 3.2). Microsomal P450s use a single redox partner: CPR, NADPH-ferrihemoprotein reductase, E.C. 1.6.2.4 [53,64,65]. CPR is a 78 kDa membrane-bound flavoprotein. It contains one molecule each of flavin mononucleotide (FMN) and flavin adenine dinucleotide (FAD). It has a hydrophobic N-terminal of 6 kDa, an FMN and FAD binding domain constituting the 72 kDa hydrophilic domain [65]. It only accepts electrons from NADPH. CPR supplies both the first and second electron in the form of a hydride ion [65,66].
Mitochondrial P450s use adrenodoxin and adrenodoxin reductase as redox partners [49]. CYTB5 can also transfer electrons from NADH to select P450s [66] but this role is not fully understood.
P450s are classified according to the above electron sources. Class I P450s are bacterial (and mitochondrial) and obtain electrons from FAD-ferredoxin reductase and Fe2S2 ferredoxin. Class II P450s receive electrons from CPR. Class III P450s catalyze reactions different to monooxygenations, such as the reduction of nitric oxide to nitrous oxide [62].
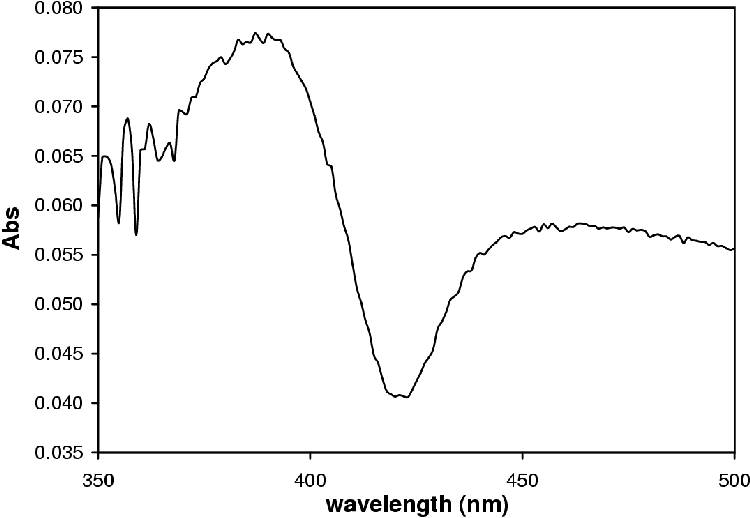
Figure 3.3 shows the proposed catalytic cycle of P450s. Step 1 sees the binding of substrate in the active site of the enzyme [68]. This results in a shift in absorbance from 417 to 394 nm as the electron orbits of the Fe atom in the heme group changes from high to low spin yielding a type I spectrum (Figure 3.4) [69].
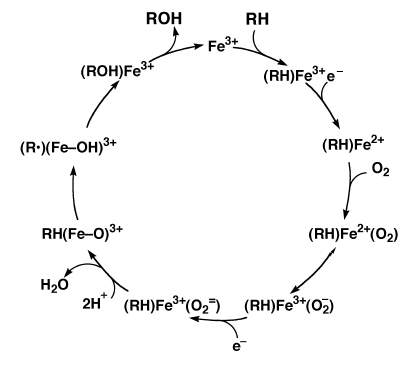
In step 2 the CPR donates the first electron reducing Fe3+ to Fe2+. In this state the heme is ready to bind oxygen. Oxygen binds to the heme group and proceeds to abstract an electron from the Fe2+. With the oxygen negatively charged, CPR donates the next electron generating an iron-oxene, Fe3+(O2=) [64].
Two protons then attack the iron-oxene complex yielding water and a highly reactive (Fe=O)3+ (step 3). This (Fe=O)3+ abstracts a proton from the substrate (RH) to produce a reactive intermediate, R· (step 4). The (Fe=O)3+ then decomposes into the oxidized product (ROH) and Fe3+. The oxidized substrate then dissociates from the P450 and the cycle can then repeat itself.
There is considerable debate regarding the correctness of this model. Some models involve a peroxy oxygen donor while others, such as the model proposed by Auchus and Miller [10], do not. The possibility exists that both reaction schemes are valid depending on the type of P450 involved.
CYP17 is important in the biosynthesis of glucocorticoids and sex steroids. It catalyzes vital reactions at the branch points between mineralocorticoid, glucocorticoid and androgen biosynthesis [1,24,28,42,70]. Only one isoform has been isolated in the adrenals and gonads. In the human there is only one known gene (located 10q24.3) while three bovine genes are proposed to exist [71]. Sequence alignment with the porcine gene shows 85% homology to that of the cow, 78% to the human and 71% to the rat. CYP17 is also expressed in the skin [27] and brain [19]. This enzyme is characterized by two activities: a 17a-hydroxylase and 17,20-lyase activity [10,16,72] that catalyze the following four reactions with NADPH supplying 2 electrons per reaction:
|
In reference to Eqn. 3.1 and 3.2, reactions a are the hydroxylase reactions and b the lyase reactions. In smaller animals the P4 pathway is favoured over the P5 pathway [10]. In larger animals the P5 pathway is preferred 100-fold over the P4 pathway for the 17,20-lyase reaction [10]. The conversion of P4 to androstenedione is reported to be one reaction where there is enough CPR and/or CYTB5 present [23,24,73]. No androstenedione is formed by human nor bovine CYP17 via 17OHP4. In yeast transformed with CYP17 it is found that the catalytic efficiency (Vmax/Km) for the P5 17,20-lyase reaction is 100-fold greater than that of the P4 17,20-lyase reaction [44]. The Km values with CPR expressed in the yeast along with CYP17 are 0.40 mM for reactions 3.1a and b; 1.1 mM for reaction 3.2a; and 6.5 mM for reaction 3.2b. How applicable these findings are to the physiological situation in the adrenal gland remains to be determined. No kcat values are available for these and related experiments.
Swart et al. [31] gives Km values of 2.0 mM for the conversion of P4 to 17OHP4; and 1.6 mM for P5 to 17OHP5 for bovine CYP17 expressed in COS1 cells. The Km for the P4 17-hydroxylase reaction is higher than that for the P5 17-hydroxylase reaction suggesting that bovine CYP17 has a higher affinity for P5 than P4.
The lyase reaction increases with an increase in the CPR concentration while the hydoxylation reaction rate is unaffected [10,73,74]. The testes have a four times greater CPR activity than the adrenal [44,46]. Both CPR and CYTB5 are required for optimum activity of the hydroxylase activity in a complex age dependent pattern [45]. At andrenarche there is an increase in androgen/estrogen production independent of the testes. The adrenal gland increases in size resulting in a higher flux from P5 to DHEA. During menopause the adrenal shrinks but the ratio of [(P5)/(P4)]:[(17OHP5)/(17OHP4)] remains constant while the concentration of DHEA declines [46].
The ratio of CYP17 to 17OHP5 concentration has been shown to alter the observations concerning the 17OHP5 to DHEA reaction [24]. The more CYP17 there is the less 17OHP5 is observed to be produced creating the impression of a single reaction.
In the testes the 17,20-lyase activity of CYP17 is equal to that of the hydroxylase activity; i.e. all the precursor steroids are converted to sex steroids [45]. Kominami et al. [66,73] have shown that the rate of 17-hydroxy-steroid dissociation from the catalytic site determines the 17,20-lyase rate at steady-state. These two activities are regulated independently [10,46]. Research has shown that CYP17 needs to be phosphorylated at serine and threonine residues by cAMP dependent protein kinase before proper interaction with CYTB5 and CPR can occur and the lyase reactions proceed [10,28,44,45,46].
While the role of CYTB5 in modulating the activities of CYP17 is uncertain there is evidence to suggest that it is in part an allosteric effector of CYP17 [10,28,44,62]. Using Ovine microsomes it has been found that CYTB5 exists as a tetramer [75] and in addition to increasing the reaction rate of CYP17 it also increases the reaction rate of CYP21 [47]. CYTB5 is found as two types: 1 and 2. Type 2 bears 45.8% homology to Type 1. These two isoforms are products of transcriptional modification [76]. Both have been shown to stimulate lyase activity [24,43,70]. Type 1 is mainly expressed in the liver, testes and zona reticularis of the adrenal with trace expression in the zona glomerulosa and zona fasiculata.
The human CYP17 gene product shows a third activity whereby P4 is converted to 16a-hydroxy-progesterone (16OHP4) [32]. This activity is not observed with P5 as substrate. The role of the 16OHP4 is not known. 17OHP4 and 16OHP4 exist at a ratio of » 4:1 in the adrenal microsome suspension and COS1 expression system [32].
CYP21 plays an important role in the production of glucocorticoids and mineralocorticoids as it catalyzes the conversion of P4 and 17OHP4 to DOC and S respectively (see Figure 2.3) [28,77,78,79]. CYP21 is expressed in the zona glomerulosa, zona fasiculata and zona reticularis [22]. It also complexes with CPR [66]. The reactions catalyzed by CYP21 are shown in reactions 3.3 and 3.4 with NADPH as electron source.
|
The conversion rates for reactions 3.3 and 3.4 are significantly different [66,80,81]. These rates are dependent on the concentration of CPR. CYP21's Kd for CPR is » 16 nM. The major difference in the two reactions' kinetics lies in the vastly different Km values. The enzyme's Km for 17OHP4 (0.7 mM) is half that for P4 (1.3 mM) in the case of the bovine enzyme [80]. For the ovine [78] and bovine [80] CYP21 enzyme expressed in COS1 cells, the rate of 17OHP4 21-hydroxylation occurs 2-fold faster than P4 21-hydroxylation. The 17OHP4 ® S reaction reaches steady-state faster than the P4 ® DOC reaction [66]. This is because the conversion rate of P4 ® DOC is faster than its rate of enzyme-product dissociation. This is not the case when 17OHP4 is the substrate because of the differences in hydrophobicity of the products. Here the conversion from 17OHP4 to S is the rate-limiting factor in the conversion of 17OHP4 to S as the more hydrophilic S dissociates faster from the substrate binding site.
CYP21 has a 20b-oxidase activity whereby it can convert 20b-hydroxy P4 to P4 in the adrenal [82]. This reaction proceeds at a rate nearly equal to that for the 17OHP4 conversion. 20b-hydroxy-steroids are produced as products of P4 and 17OHP4 metabolism in the ovaries, adrenal gland, placenta and testes by 20b-HSD. These products inhibit CYP17 activity and may serve to divert androgen synthesis in immature animals. CYP21 may regulate against over production of 20b-hydroxy-steroids. CYP21's Kd for 17a,20b-hydroxyP4 is 2.3 mM, which is higher than the Km values for the normal substrates P4 and 17OHP4.
A lack of normally active CYP21 results in congenital adrenal hyperplasia (CAH) [81]. The classical form has an incidence of 1 in 15 000 births (compared to 1 in 250 000 for cystic fibrosis, a relatively common genetic disorder) [81,83,84]. This disorder is characterized by an increase in androgen synthesis as the conversion of steroid precursor to mineralocorticoids and glucocorticoids is blocked [1]. The physiological result is virilization and severe salt loss in classical cases while the mild form results in acne. The mild form has an incidence of 1 in 100 births. 90 to 95% of the CAH cases are due to a reduction in CYP21 activity. The V218L mutation is present in the majority of mild cases and the resulting enzyme retains as much as 64% of its activity whereas in the classical form (caused by various mutations) only 7 to 10% of the enzyme activity may be retained [81]. The P30L, I172N and V281L mutations result in a decreased Vmax but unchanged Km. The P453S mutation lies in the heme binding domain of the protein.
There are two isoenzymes in the ovine adrenal that differ in their 3' region [78]. The first isoform is similar to the bovine, murine and human protein while the other is truncated approximately 500 bp from the C terminus resulting in a -18 residue protein that is inactive. There is, however, only one gene, the two forms being the product of differential mRNA splicing.
The human, murine, bovine and ovine genomes have a CYP21 pseudogene. The structure of CYP21 locus has been discussed in section 2.3.2.
The first hydrophobic domain of CYP21 is the membrane targeting and anchoring domain and is important in in vivo protein stability. CYP21 is degraded physiologically in a monophasic pattern and has a half life of approximately 24 hours. The truncated forms have a much shorter half life [78].
As CYP17 and CYP21 are at the central branch points of steroid biosynthesis many complicated features have evolved to maintain homeostasis. It is speculated that the ratio of substrate to enzyme concentration could play an important role in the modulation of the 17a-hydroxylation and 17,20-lyase activities, and likewise the activities of CYP21 [24].
Many questions remain to be answered regarding P450 kinetics and structure.
There is evidence that the lipid environments of the CYP17 affect its kinetics [62]. As consequence, even if the CYP17 and CYP21 could be isolated from the membrane and kcat values could be determined for the enzymes and the Kd values worked out for all the interactions, the accuracy and worth of these values could still be questioned. Table 3.1 lists Vmax and Km values for CYP17 and CYP21 derived in various experimental systems. While the trends of a higher CYP17 affinity for P5 and CYP21 affinity for 17OHP4 can be seen, it is clear that the values vary significantly from expression system to expression system. All these reasons make it impossible to define each enzyme's effect on the pathway it forms a part of using traditional techniques.
In the next Chapters two techniques will be employed to escape the problem of varying results from one expression system to another. The first technique will be that of Control Analysis. The other will be metabolic modeling.
Control Analysis is a mathematical approach to quantifying the concepts of control and regulation. To employ this approach no detailed knowledge of the kinetics is needed. Using Control Analysis response coefficients, control coefficients and elasticities can be calculated through experiments where individual enzyme activities are perturbed and changes in flux measured [85]. No quantitative information regarding the character of each enzyme are required, only that it be possible to vary the activity of one enzyme in a pathway independently of the others and a steady-state be attained under experimental conditions.
For P450 enzymes one need no longer obtain the Kd values for the protein-protein interactions; nor the reaction rate constants. As long as the relevant P450's activity can be manipulated independent of other enzymes in the pathway it is possible to quantify each P450's effect on its respective pathway.
It is possible to construct a mathematical model of the steroidogenic pathway using the Km values and relative enzyme activities obtained through parallel transfection assays. From this model control coefficients can be calculated.
The construction of a Gepasi model will be discussed in the next Chapter.
p0.08p0.155rrp0.11cc P4
It is important that the concepts of regulation and control be separated for the purpose of this chapter and the understanding of the questions being asked in this thesis. This was already done in the introductory Chapter on page pageref. To recap: an enzyme's activity is regulated; and reaction rate (flux) or metabolite concentration is controlled.
While the regulatory mechanisms are important for a complete understanding of steroidogenesis the explicit topic of this thesis is the control over steroidogenic flux. The question is: what degree of control does CYP17 and CYP21 have over the CYP17/CYP21 branch point of mineralocorticoid and glucocorticoid synthesis? We therefore need to calculate concentration (Cse) and flux control coefficients (CJe) for the relevant enzymes and metabolites to answer these questions.
In Chapter 1 the question of rate-limiting steps in steroidogenesis was addressed. This chapter does not focus on these questions any more than to say that there need not be one lone rate-limiting step. The analytical framework of Control Analysis, while not ruling out the possibility of one rate-limiting step per pathway, suggests that each reaction in a pathway can posses some degree of control over the flux and metabolite concentrations in the pathway [12]. With the model and experiments described below we cannot elucidate the degree of control CYP17 and CYP21 has over the whole steroidogenic network but we can determine if they have any control over the branch point under investigation.
As explained in Section 2.3, the steroidogenic network only occurs as displayed in Figure 2.3 on paper. In reality the three branches of adrenal steroidogenesis (Figure 2.5) are separated anatomically. While in theory the enzymatic reaction of P5®17OHP5®DHEA may have control over mineralocorticoid and glucocorticoid synthesis in reality this reaction to DHEA does not occur in the adrenal zones where mineralocorticoid and glucocorticoid synthesis occur. For these reasons the model proposed below should not be taken out of context. Conclusions drawn from the model can only strictly apply to the model, but may offer insights into the real system.
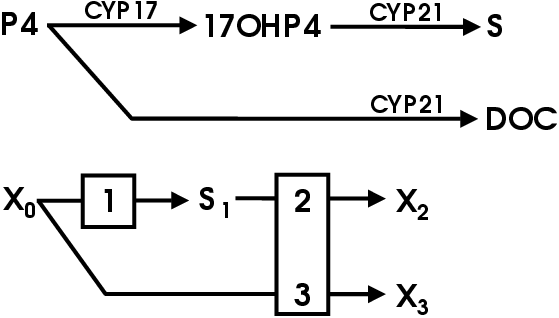
The model pathway is displayed in Figure 4.1. CYP17 converts P4 to 17OHP4 (reaction 1). CYP21 converts 17OHP4 to S (reaction 2) and P4 to DOC (reaction 3). There is competitive inhibition between P4 and 17OHP4 for the steroid binding site on CYP21 and competition between CYP17 and CYP21 for P4.
The balanced reactions are given in equations 4.2 to 4.4.
|
Km and Vmax values have been determined by means of the
Michaelis-Menten equation (Eqn. 4.4) in the experiments by
Swart et al and Lorence et al [31,80].
| (4.4) |
The Km values are sound. As seen in Table 3.1 the Km values for CYP17 and CYP21 are constant within the COS1 expression system.
The Km values chosen for the model are presented in Table 4.1.
| Km | Reference | |
| reaction 1: | 2 mM | [47] |
| reaction 2: | 0.7 mM | [80] |
| reaction 3: | 1.3 mM | [80] |
Michaelis-Menten kinetics (Eqn. 4.4) was used, where aV replaces Vmax and represents the relationship between enzyme concentration (a) and the rate per unit enzyme, V (mmol/hr/% tissue culture dish slice). V is in essence a kcat value describing the turn over per tissue culture dish slice. The Michaelis-Menton equation was modified to allow for competitive inhibition. For the Ki values, the respective Km values were used.
The general equation is:
| (4.5) |
The equations for each reaction are:
Reaction 1: for the conversion of P4®17OHP4:
| (4.6) |
| (4.7) |
| (4.8) |
| (4.9) |
| (4.10) |
| (4.11) |
| (4.12) |
To complete and validate the above model the following was needed:
The next sections present the data used in meeting these criteria.
All enzymes have some affinity for their products. The experiments by Kominami et al. [66] show that CYP21 has more affinity for its product DOC relative to S. It was also shown that CYP17 retains little affinity for 17OHP4 [23]. Microsome P4 conversion assays and steroid binding assays were performed to test the extent of product inhibition.
Experiments were carried out using ovine microsomes in the presence of 10 mM P4 and 10 mM DOC or 10 mM S and the metabolite concentrations traced over 10 minutes. If the products DOC and/or S had any measurable effect on the final product concentrations it was expected to be visible at high inhibitor concentrations.
The materials were obtained and the experiments performed as described in Appendix A. All experiments were performed in triplicate. The P450 and protein concentration were determined as described in Section A.2.4, page pageref. Figure 3.1 shows the CO-difference spectrum obtained from which the concentration was determined. The P450 concentration was determined to be 11.6 ±1.3 mM; and the protein concentration to be 18.2 ±1.4 mg/mL (specific activity of 0.637 mM P450/mg protein).
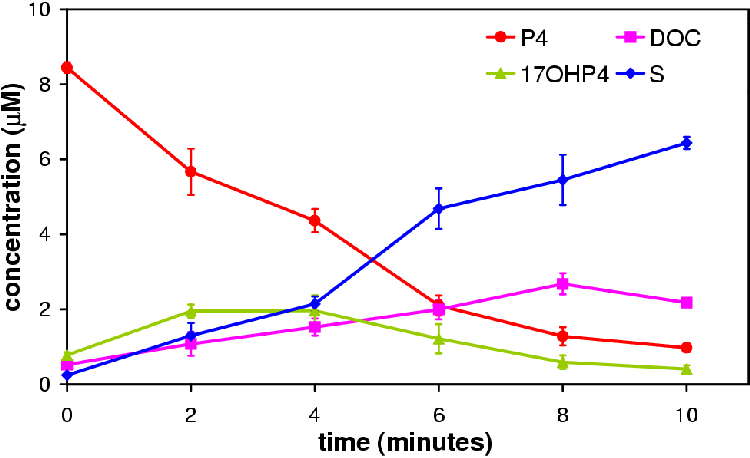
Figure 4.2 represents a normal P4 conversion profile over 10 minutes using ovine adrenal microsomes. Of note is the pseudo-steady-state characteristic of adrenal microsome P4 conversion. The 17OHP4 concentration increases slowly to a point where its rate of synthesis is matched by its rate of conversion to S giving rise to a pseudo-steady-state. In the microsome system eventually the P4 concentration falls to a level where the synthesis of 17OHP4 is slower than its conversion to S. This creates a false impression of steady-state, the so called pseudo-steady-state. A true steady-state (flux) would only shift in response to a change in a pathway parameters.
It is the metabolite concentrations at pseudo-steady-state that are of interest. To draw conclusions regarding the effect of DOC and S concentrations on steady-state flux and concentration we must compare steady-state flux and concentration values. The microsomal system allows this to be done at the pseudo-steady-state.
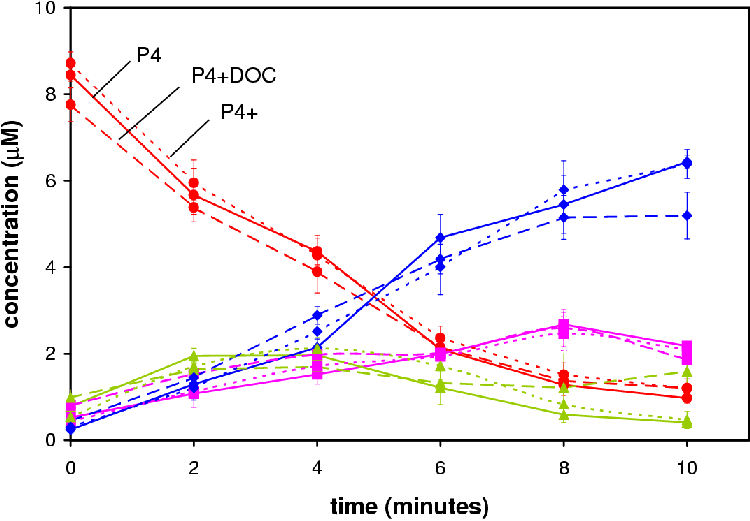
In Figure 4.3 the time course of all three experiments is shown. The P4 declines at nearly the same rate in all the experiments. The variation between the points falls within the range of the experimental error. If either product had an affect on the metabolite profile it does not appear to be in the conversion of P4 to DOC or 17OHP4.
The concentration of DOC in each experiment at 8 min is near equal while at 10 min the concentration of DOC decreases. This observation does not make sense unless there is another reaction occurring that is metabolizing the DOC to a compound not monitored for in the TLC. Samples run on HPLC showed no unaccounted metabolite (results not shown). No explanation is available for this observation hence 8 min was regarded as the end point.
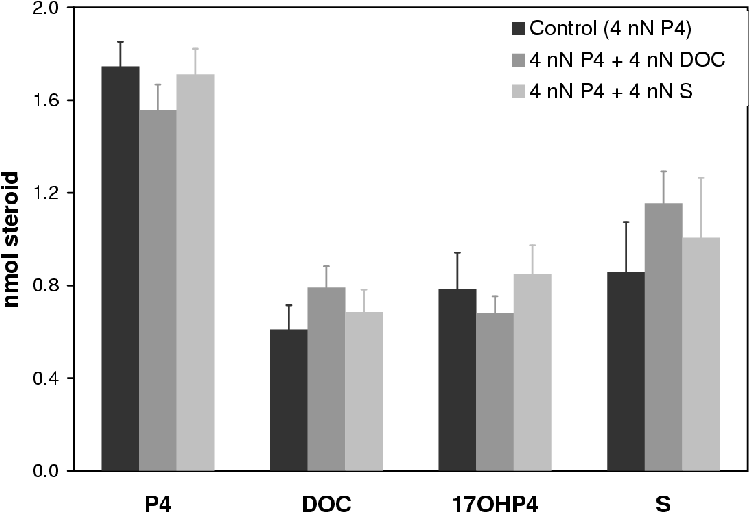
Figure 4.4 compares the concentrations of the metabolites at 4 min. Statistical analysis of the samples using the software of GraphPad Prizm revealed no statistical difference (p > 0.05). This suggests that DOC and S do not affect steady-state flux and concentrations.
Substrate binding microsome difference spectrum scans were performed to test for steroid binding. Experiments were performed as in Section A.2.3, page pageref. The reference cell held 1 mL 1 mg/mL microsome suspension (final P450 concentration 0.64 mM) with ethanol plus inhibitor. For the experiment the spectrophotometer was zeroed with the volume inhibitor (10 mL steroid to final concentration of » 60 mM, enough to saturate all CYP present) added to both cuvettes. The steroid (10 mL steroid to final concentration of » 60 mM, enough to saturate all CYP present) was then added to the experiment cuvette and the equivalent volume ethanol to the reference cuvette. The experiments performed are listed in Table 4.2 along with the volumes 2 mg/ml steroid stock solution.
| volume | |||||
| experiment | EtOH | P4 | 17OHP4 | DOC | S |
| ethanol control | 20 mL | - | - | - | - |
| P4 spectrum | 10 mL | 10 mL | - | - | - |
| P4 vs 17OHP4 | - | 10 mL | 10 mL | - | - |
| P4 vs DOC spectrum | - | 10 mL | - | 10 mL | - |
| P4 vs S spectrum | - | 10 mL | - | - | 10 mL |
| 17OHP4 spectrum | 10 mL | - | 10 mL | - | - |
| 17OHP4 vs P4 spectrum | - | 10 mL | 10 mL | - | - |
| 17OHP4 vs DOC spectrum | - | - | 10 mL | 10 mL | - |
| 17OHP4 vs S spectrum | - | - | 10 mL | - | 10 mL |
The microsome substrate binding scan of P4 is shown in Figure 3.4. The scan for 17OHP4 was similar. There was no effect by ethanol nor was any measurable effect observed for DOC or S.
A summary of the results is given in Figure 4.5. Except in the case of S in combination with 17OHP4, inhibition was insignificant (less than 5%).
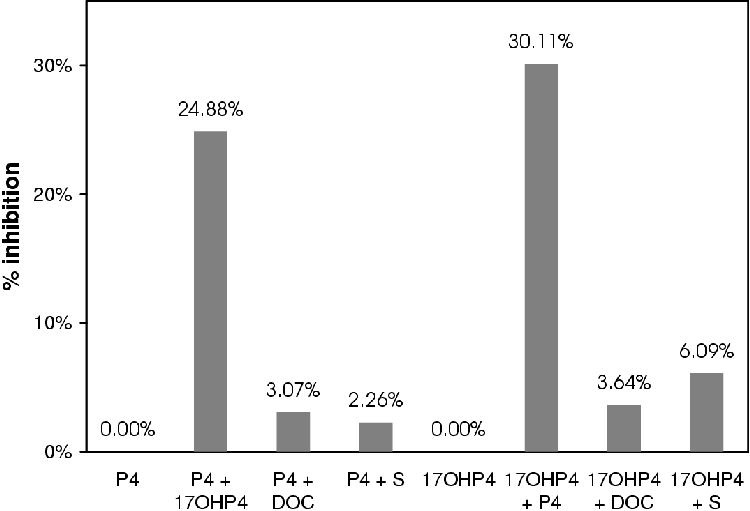
If at such high concentrations of inhibitor there are such small effects it is reasonable to assume that the enzymes are not inhibited by their products at the concentrations used in the tissue culture assays.
The total physiological concentration of cortisol in human blood is 3.8 nM [1]. With such a low physiological concentration product inhibition is unlikely to occur in situ.
For these reasons the inhibitory effect of DOC and S are judged to be inconsequential to the construction of the model due to their small influence at high concentrations.
The Parallel transfection method [6] allows for the manipulation of the individual expressed CYP enzyme activities without having to purify the enzymes and reconstitute them in an artificial lipid environment. Working in the controlled environment of tissue culture removes the uncertainties of microsome experiments where enzyme contamination could yield experimental artifacts or metabolize products to unresolvable unknown metabolites.
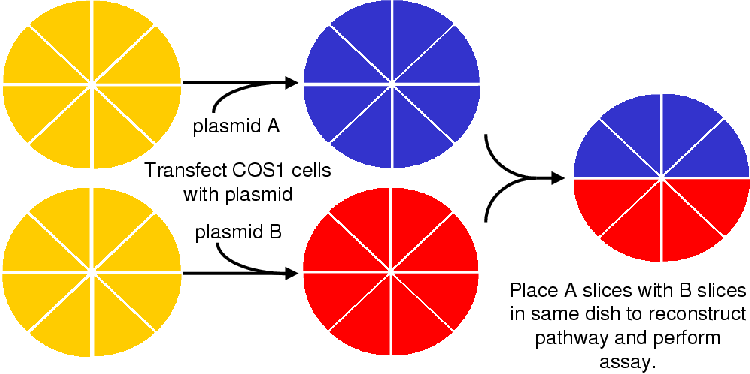
A brief description of the Parallel Transfection method was given in Chapter 1. As Figure 1.2 shows, COS1 cells are grown up in petri dishes to 80% confluency as described in Section A.4. At 80% confluency the cells were split 1:6 and plated onto the slices as described in Section A.4.6. The cells were transfected 24 hours after splitting. One set of dishes was transfected with a bovine CYP17 containing plasmid and the other set with a bovine CYP21 plasmid. The transfected cells were left to grow for three days before the experiment was initiated.
For the experiment the medium was siphoned off and with sterile tweezers the individual slices were removed from the dishes and recombined with the other slices in a new dish. The experiment was carried out with a P4 concentration of 1 mM (yielding a total of 10 nmol steroid per 10 mL dish) as described in Section A.5. The assay endured for 12 hours where after there was not enough medium in the dishes to proceed further.
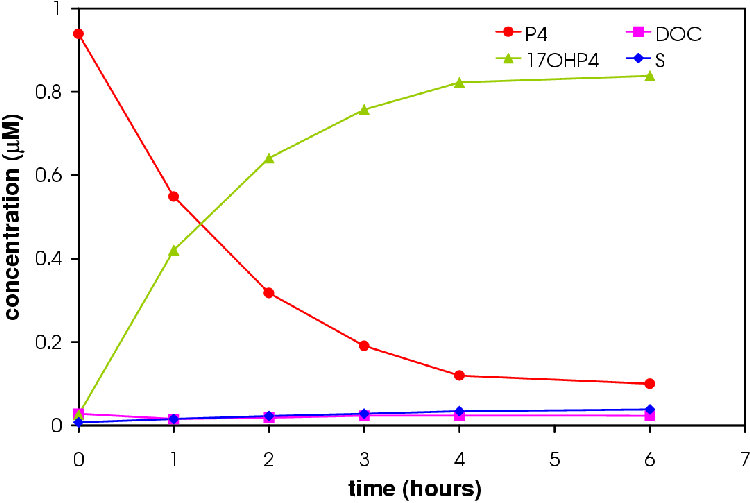
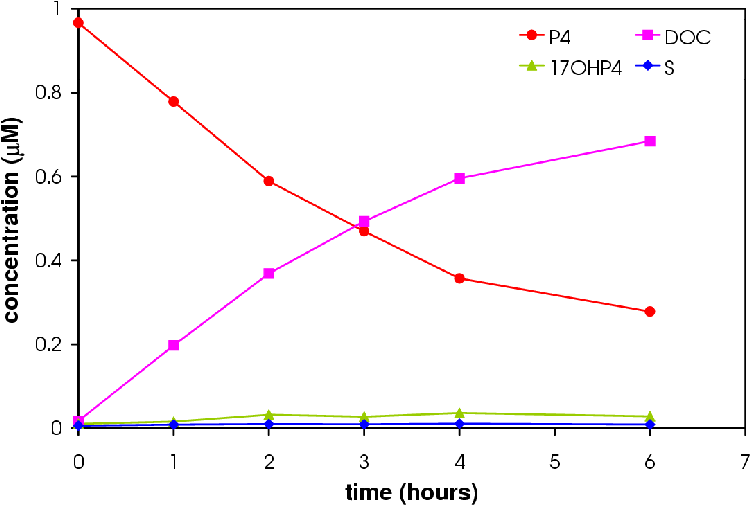
Figures 4.6 and 4.7 show the conversion profile from P4 to 17OHP4, DOC and S over 12 hours.
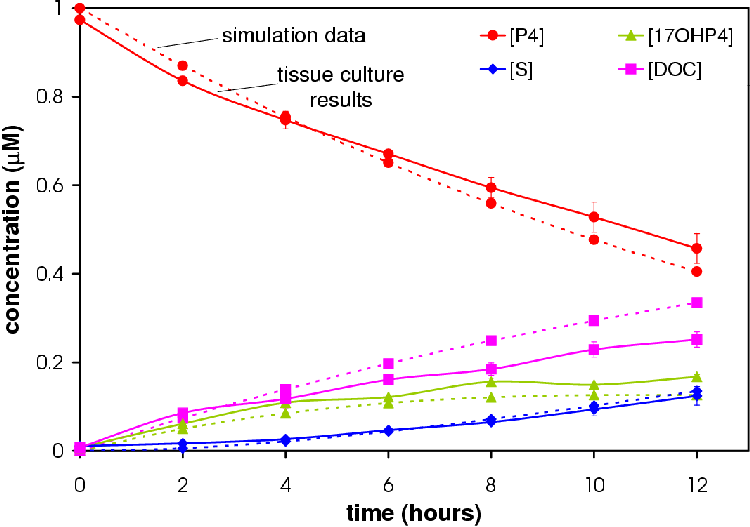
Increasing the amount of CYP17 results in an increase in the amount of 17OHP4. More S is produced in the 6 CYP17:2 CYP21 experiment relative to the amount of DOC produced in accordance with the hypothesis that a higher concentration CYP17 will result in a higher concentration of S.
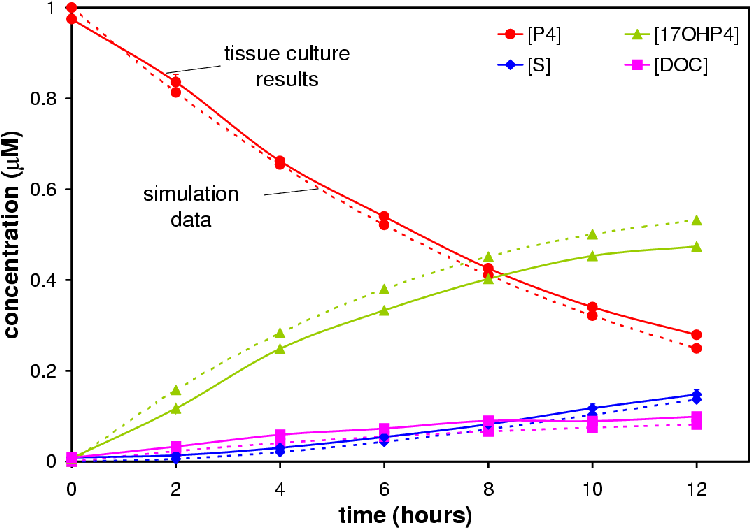
Only the 2 CYP17: 6 CYP21 experiment reached a pseudo-steady state (see Figure 4.8). The 6 CYP17: 2 CYP21 experiment came close to reaching the pseudo-steady-state seen in microsomes.
Samples taken from the experimental medium were resolved by TLC as described in Section A.1.1. In addition to the mixed dishes there was a full CYP17 and CYP21 dish and untransfected control dishes. Samples from the untransfected dishes run on HPLC (see Section A.1.3) showed no steroidogenic activity (data not shown). The conversion profile of the full CYP17 and CYP21 dishes is shown in Figures 4.9 and 4.10.
The model fitting/optimizing utility of Gepasi [90] was used to fit the model to the experimental data in Figures 4.6 and 4.7. The model was programed with the Km and Ki values for the enzymes in addition to the a value-the amount of enzyme (slices), eg.: 25 and 75 for a ratio of 2 CYP17: 6 CYP21. The V value was then fitted to the experimental profile. A fit was performed for each data set (n=6). The Evolutionary programing for optimization algorithm of Gepasi was used for the optimization. The generations were 1000 and the population set at 100. Sum of Squares was determined for each fit and ranged from 0.002 to 0.030 with a median value of 0.012. The results of the fit as well as the complete set of kinetic values per reaction are given in Table 4.3.
| Reaction | Km | Ki | V | se |
| 1 | 2.0 | N/A | 0.003925407 | ±0.000480 |
| 2 | 0.7 | 1.3 | 0.002387223 | ±0.000182 |
| 3 | 1.3 | 0.7 | 0.001002907 | ±0.000234 |
Data from simulations based on the optimized model were correlated to the experimental data. Simulations were performed based on 2 CYP17: 6CYP21 and 6 CYP17: 2 CYP21 ratios. Correlations were 0.995691 and 0.988375 respectively (see Figures 4.6 and 4.7) . Correlations were calculated using Microsoft Excel.
It can be argued that by comparing the simulation based on the fitted V values to the experimental data proves nothing. This is not so. The V values are derived from 2 different experiments comprising 3 data sets each. The V values in Table 4.3 are medians of the 6 data sets. If the one experiment deviated from the other experiment in respect to the fitted V values then the correlation between experiment and simulation would be less. The high correlations of 99% indicate that the model fits both experiments accurately. It is reasonable to assume it would correlate accurately with other experiments performed with the Parallel Transfection technique and is a fair representation of the physiological CYP17/CYP21 branch point.
The model cannot be compared to the individual enzymes because the the V values obtained from the experiments are from a system where there is competition for substrate and substrate binding sites. Due to this competition the V values will be inaccurate under-estimations of the true kcat values for each enzyme expressed in COS1 cells.
This high correlation between the model and experiment is encouraging but further experimentation is needed to be confident in the model's ability to predict and explain characteristics of the COS1 and in situ system.
In the next chapter the model will be subjected to structural and Control Analysis where after the model will be manipulated and simulations run to test hypotheses drawn from the Control Analysis.
The goal in this chapter is to apply Control Analysis to the
CYP17/CYP21 branch point in an effort to determine which reactions
have control over the flux and metabolite concentrations and to
what degree they have this control. Two methodologies will be
employed to accomplish this task. The first are Structural
Analysis developed by Sauro et al. [91,92] and Control Analysis [93,94]. Using
Structural Analysis the the branch point will be expressed
mathematically. The purpose of this is to derive the Identity
Matrix [14]:
| (5.1) |
| (5.2) |
| (5.3) |
The K along with the the elasticity matrix, -e, will need to be derived. By assuming that the reactions are irreversible and there is no product sensitivity conclusions can be drawn about whether the control lies in the supply of substrate, the metabolism of metabolites or demand for product [15].
Using the computer model presented in Chapter 4 the hypotheses constructed from the results of the Control Analysis will be tested and the effects of enzyme activity on each step demonstrated.
The model scheme presented in Figure 4.1 does not reach a steady-state nor does it include a steroid precursor supply step nor metabolite demand step. For the purposes of Control Analysis a new model scheme is presented in Figure 5.1 that includes a supply and demand step.
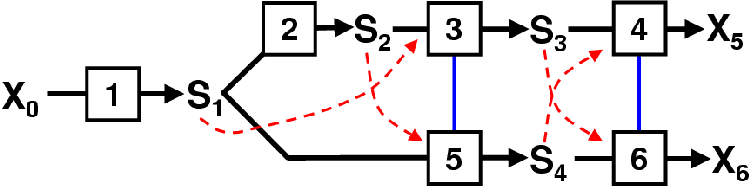
In Figure 5.1 a supply block has been added that supplies S1 (P4). This reaction 1 (R1) is not the reaction catalyzed by 3bHSD on Figure 2.3 but instead represents the pathway from cholesterol to P4. The demand block is represented by reactions 4 (R4) and 6 (R6). These can be regarded as the reactions catalyzed by CYP11B1 in Figure 2.3.
For Structural and Control Analysis, no detailed information regarding the kinetics is needed.
The use of matrices and their use in Control Analysis is explained by J.-H.S Hofmeyr [14,95]. For the sake of brevity non-informative steps will be neglected from the text. The readers is advised to consult references [14,91,92,95] for a full step-by-step explanation of the mathematics.
The stoichiometric matrix is defined as:
| (5.4) |
Where N is the stoichiometric matrix of dimensions m×n where n is the number of reactions and m the number of variable metabolites. v is the column vector of reaction rates; and p a p-dimensional column vector of parameters. X0, X5 and X6 are fixed as constants: 1, 0 and 0 respectively.
Our model can be represented in matrix form as shown in Eqn 5.5.
| (5.5) |
| (5.6) |
The NR matrix relates flux (J) not reaction rate (v) and hence ds/dt = 0. This reduced matrix shows that all the fluxes can be expressed in terms of J4 and J6. It also shows that s2 is dependent on the R4 (Jb). This leads to the flux relationships J = KJi as shown in Eqn. 5.7.
| (5.7) |
The K matrix (Eqn. 5.7) is scaled to K = (DJ)-1KDJi (Eqn. 5.8) that now expresses the flux relationships in terms of the independent (J4 and J6) and dependent fluxes (J1).
| (5.8) |
The Identity Matrix is given in Eqn. 5.1. The term K-e can offer insight into the pathway. This term is presented in Eqn. 5.9
| (5.9) |
| (5.10) |
The author is not the first to suggest this. In Chapter 1, page pageref, it was stated that StAR and CYP11A1 have been proposed as being the rate-limiting step of steroidogenesis [13]. The Control Analysis of the pathway in part supports this statement by Clark et Stocco [13]. It does not support the concept of a single rate limiting step, nor which step in the supply block has the most control.
To obtain the control coefficients one can solve the matrix Eqn. 5.1 or employ the model created in Gepasi [90] that was the topic of Chapter 4.
The allure of a computer model is that a years experiments can be carried out in one afternoon in silica.
The model as defined in Figure 5.1 will be used for simulations. The CYP17 and CYP21 kinetics as defined in Table 4.3 were used for R2 and R3,5. The R1, R4 and R6 were assigned kinetics in accordance with the assumption that the reactions are irreversible and insensitive to product. The Km values are no higher than the lowest Km for the CYP17 and CYP21 reactions and the V values no lower than the highest V. a = 100 for all reactions.
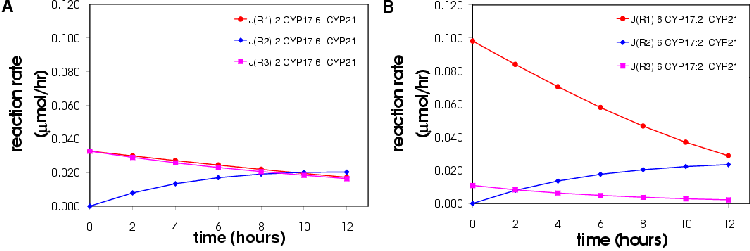
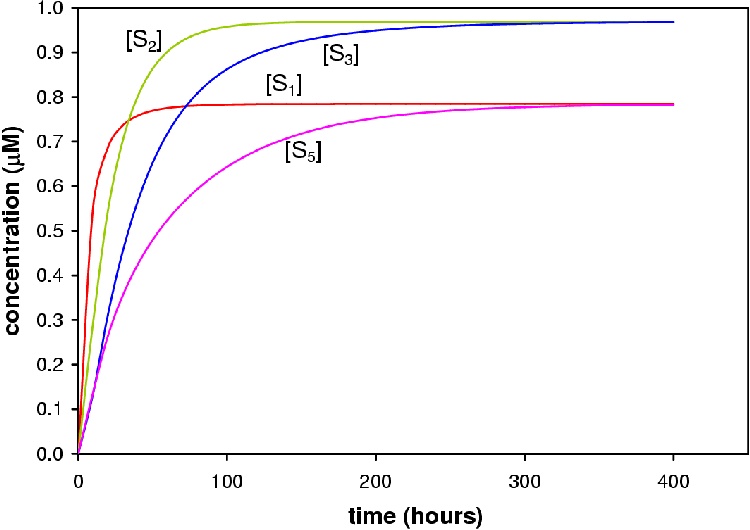
From the simulation run with X0 set to 1 mM it can be seen that P4, 17OHP4, DOC and S reach a steady-state from » 400 hours (Figure 5.2). This result does not imply that the steroidogenic network or COS1 cell expression system will reach steady-state in 400 hours only that the model as laid out above does. s2 (17OHP4) and s3 (S) lie close together and the concentration increases occur in concert. s1 (P4) and s5 (DOC) also lie close together and follow the same pattern of increase. S1 and S5 reach steady-state later than S2 and S3. The fluxes are given in Table 5.1. At equal enzyme concentrations the CYP17 branch (Jb) of the pathway has a higher flux than that of the CYP21 branch (Jc).
| Metabolite | flux |
| R4 | 0.055 |
| R6 | 0.010 |
| total | 0.065 |
The flux and substrate control coefficients in respect to e2 (CYP17) and s3 are shown in Table 5.2. These values confirm the hypothesis that the control rests in the supply of P4 to the branch point. The natural question is what happens then if we alter the activities of each reaction? Will the control still rest with the supply of P4 if the demand reaction rates (4 and 6) are increased? What happens if we vary the activity of reaction 1, 2 and 3/5? These are the topics for the next sections.
| Flux control coefficients =. | Concentration control coefficients | ||||
| Cv1Jb | =1 | .18 | Cv1s3 | =2 | .82 |
| Cv2Jb | =0 | .16 | Cv2s3 | =-0 | .15 |
| Cv3Jb | =-0 | .16 | Cv3s3 | =0 | .14 |
| Cv4Jb | =0 | .00 | Cv4s3 | =-2 | .38 |
| Cv5Jb | =-0 | .18 | Cv5s3 | =0 | .17 |
| Cv6Jb | =0 | .00 | Cv6s3 | =-0 | .60 |
In this in silica experiment the value of a1 was varied from 1 to 200 while all other a values were fixed at 100. The concentration steroid precursor was fixed at 1 mM. The result of the simulation is shown in Figure 5.3.
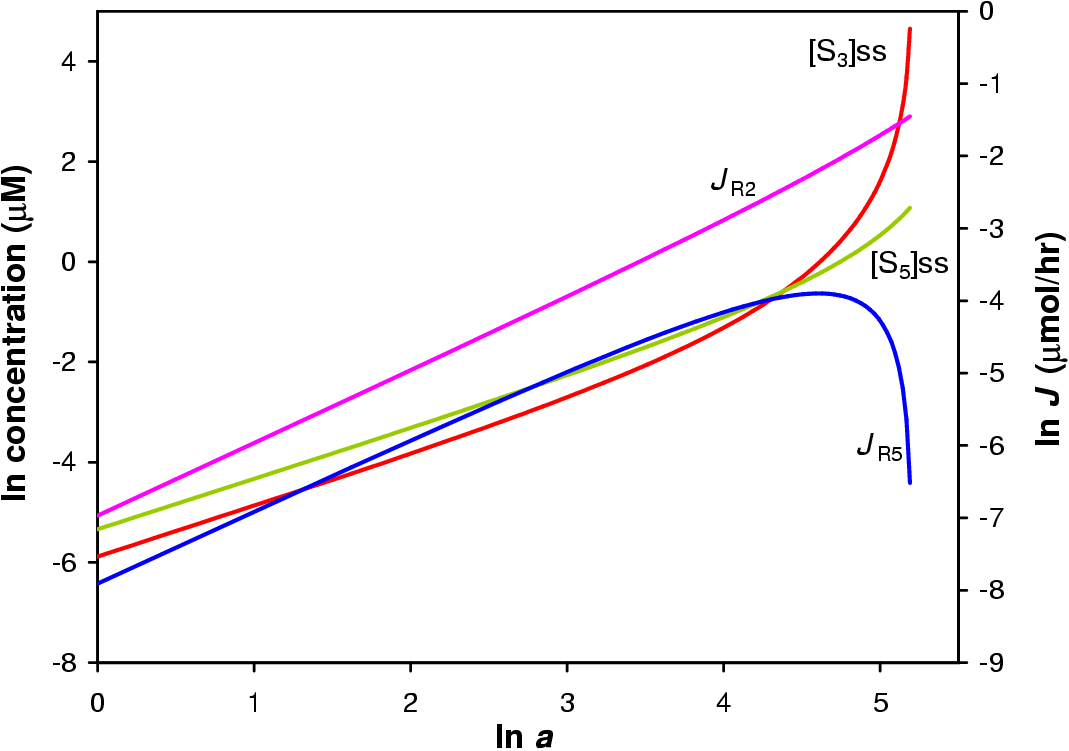
Increasing a1 to 180 yields a ratio of s3 (S) to s5 (DOC) of » 36:1 with s3 increasing exponentially. At this value of a Jb is 158× greater than Jc. The increase in Jb is linear while the increase in Jc is only linear up to a=50 where it peaks and decreases sharply. This is due to the inhibitory action of S2 (17OHP4) on R5. As a result there is less flux through branch c and less S5 and X6.
a2 was varied from 1 to 200 while all other a values were fixed at 100. The concentration steroid precursor was fixed at 1 mM. The result of the simulation are shown in Figure 5.4.
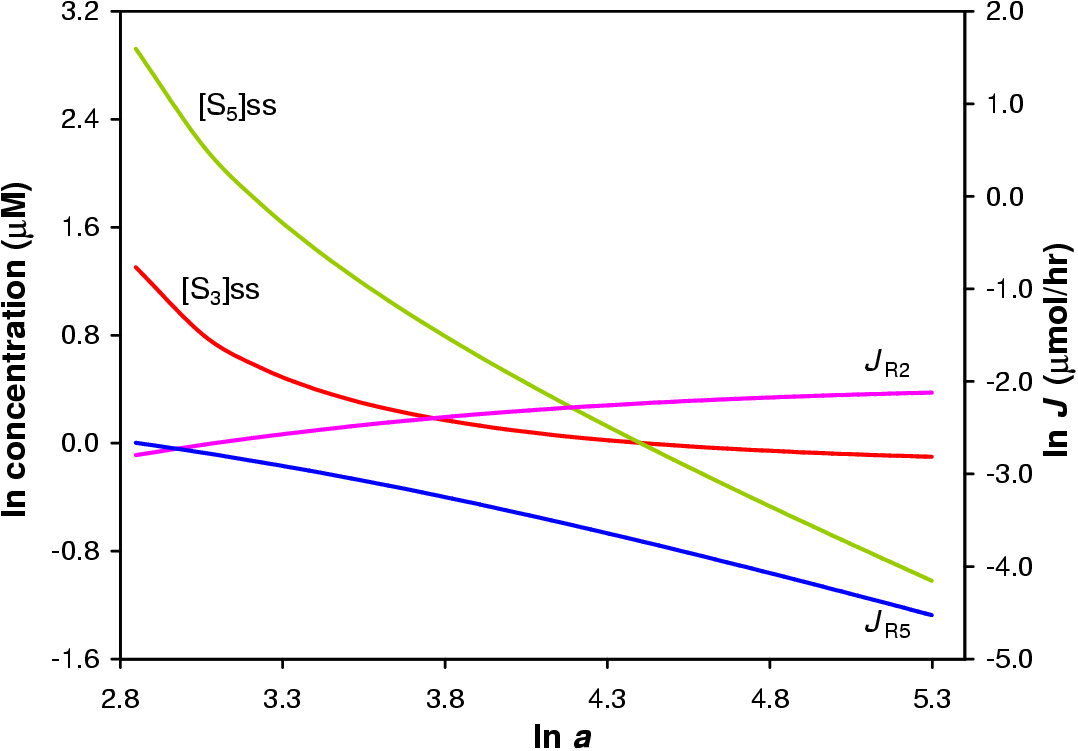
The simulation shows that by varying the activity of E2 a 251× difference between s3 and s5 is had. More S3 is produced relative to S5 at a2=82. From this point s5 declines near linearly due to the inhibitory action of S2 (17OHP4). The s3 also declines, at 7% of the gradient of the s5 decline, due to the inhibitory action of S3 on R6. This will result in a higher reaction rate for R4 and faster metabolism of S3 to X4.
Jb begins to exceed that of Jc from a=21. At a=200 Jb is 11× greater than that of Jc. If E2 (CYP17) exercised full control over Jb then one would expect to see a much larger difference and the trace in Figure 5.4 of Jb to of been a near straight line. This is not seen. E2 has only a portion of the control over the pathway (see Table 5.2).
In this simulation a was varied from 1 to 200. The results of this simulation are shown in Figure 5.5. Because R3 and R5 are catalyzed by the same reaction, varying one's a value will result in the equivalent change in the a value of the other reaction in the model.
A 258× difference between s5 and s3 can be achieved by varying the activity of E5 from a5=1 to 200. At 200 s5 is increasing linearly while s3 increases only slightly due to the inhibitory action of S5 on R4.
Jb is 0.58× less than Jc at a5=200. At twice the concentration of E2, E5 cannot shift the bulk of the flux from branch b to branch c. This effect may be due to the concentration of S2 (17OHP4) rather than the concentration of E2.
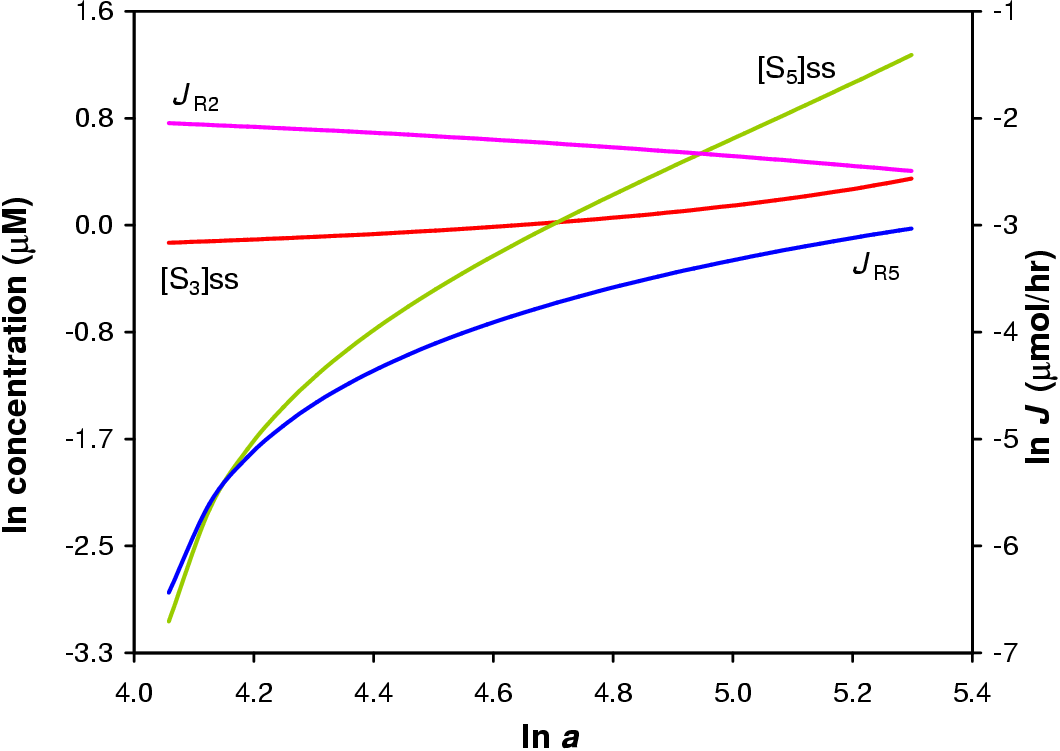
The three last sections have shown that E2 and E5 have little impact on the flux through either pathway and that the supply block (reaction 1) has the largest effect on the flux and steady-state concentrations of S3 and S5. The question remains: what control does the demand for S3 and S5 have over the pathway.
The value of a for R4 and R6 was varied from 1 to 200. Because R4 and R6 are catalyzed by the same reaction, varying one's a value will result in the equivalent change in the a value of the other reaction in the model. No steady-state was found for a < 47. The results of this simulation are shown in Figure 5.6.
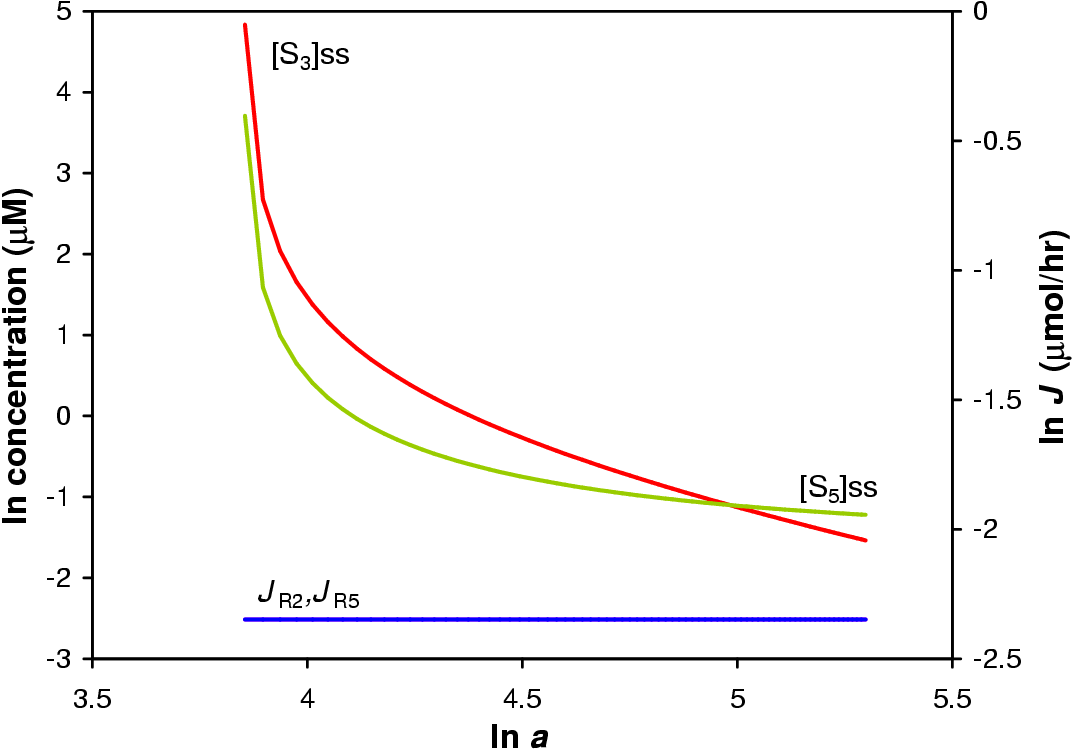
Jb and Jc do not change in respect to a change in demand and the change in ratio S3 to S5 is not large. The demand for steroid product within the pathway has no control over the flux through the pathway.
Using a purely mathematical approach assuming that the the reactions depicted in Figure 5.1 are the only reactions to occur involving the included metabolites and that all reactions are irreversible and the enzymes insensitive to product it was shown that the supply of steroid precursor has the most control over the model pathway.
Using the model simulations it was shown that only by modulating the reaction rate of R1 is the flux and steady-state concentrations of metabolites seriously perturbed. Varying the activity of R2 and R5 had effects on the flux and metabolite concentrations but not as dramatic as varying the activity of R1. While some large changes in metabolite concentrations were observed for variations in a2 and a3 there was very little change in the flux. It is the flux that is important as in the stress response the goal is a larger turnover of steroid in the adrenal not higher adrenal steroid concentrations. Varying the activity of the demand reactions had very little effect on the ratio of s3 to s5.
For the model system, control over flux and steady-state concentrations lies in the supply of steroid precursor.
The central questions to be answered in this thesis were: what degree of control does CYP17 and CYP21 have over the CYP17/CYP21 branch point of mineralocorticoid and glucocorticoid synthesis and which enzymes have the most control?
To answer this question a model describing the branch point was constructed. The model was analyzed mathematically using Structural and Control Analysis. Using the model, thought experiments were performed in silica to ascertain the effect of the enzymes in the model pathway. From this data concentration and flux control coefficients were calculated.
Using the data presented in Section 4.3 a model was constructed using Michaelis-Menton kinetics and Km values from the literature [31,80]. The V values were derived by fitting the model to the experimental data using the evolutionary fitting module of Gepasi [90].
This model accurately (99% fit) describes the branch point as reconstituted in tissue culture (see Section 4.3.2).
With arbitrary modification of the initial model a model capable of reaching a steady-state in silica was constructed.
Using Structural Analysis to express the pathway mathematically and applying Control Analysis it is evident that the bulk of the control over the pathway flux lies in the supply of P4 (see Section 5.1.2).
The data obtained from computer simulations using the steady-state model show that both the model CYP17 and CYP21 exert an effect over the branch point and the flux through either branch (see Sections 5.2.2 and 5.2.3).
The data from the experiment varying the supply of P4 (see Section 5.2.1) shows that the supply of P4 to the branch point has a larger affect on the distribution of flux than varying either the model CYP17 or CYP21 as hypothesized from the results of Control Analysis.
Table 5.2 shows the control coefficients calculated by the Gepasi model.
Cv1Jb and Cv1s3 have 88% and 90% of the flux and concentration control respectively. Cv3Jb is negative because as R3 converts S2 to S3 the inhibitory effect of S2 on R5 is lessened resulting in a decrease in Jb. Cv5Jb is negative because R5 produces S5 that inhibits R4 decreasing Jb. Cv2s3 is negative because S2 inhibits R5. A lower R5 activity will mean a higher R4 activity effectively increasing the rate of S3 to X4 turnover. For this reason Cv4s3 is also negative. Cv6s3 is negative because a high S5 to X6 conversion rate would mean there is less total S5 in the system to inhibit R4.
From the data presented in this thesis it must be concluded that the model CYP17 and CYP21 do not exercise as large an influence over the CYP17/CYP21 branch point as believed.
The data indicates that the supply of P4 to the branch point is the major determinant in the distribution of flux through the CYP17 branch of the pathway. This conclusion lends support to the hypothesis that the flux control over steroidogenesis lies in the supply of cholesterol/pregnenolone [13]-if it can be assumed that the enzymes involved in cholesterol transport and conversion have similar kinetic properties as the other enzymes in the pathway.
It is the anatomy and mobilization of cholesterol in response to ACTH and/or angiotensin II that determines the ratio of steroid products released from the adrenal cortex. Only under extreme circumstances, where the activity of CYP17/CYP21 is severely reduced, does CYP17/CYP21 exert any control by creating a metabolic bottle-neck. This bottle-neck sees a spill over of steroid precursor being directed down alternative pathways causing physiological abnormalities.
More data is needed to validate the model. While the current data is initially convincing it is never the less inadequate. The experiments need to be repeated and more experiments performed in tissue culture and the V values recalculated with greater accuracy.
To test this hypothesis further the experimental system will need to be overhauled. A system will need to be constructed that can be more finely manipulated and to which more enzymes can be added.
The methodologies presented in this thesis have the possibility to provide mathematically quantifiable explanations of adrenal steroidogenesis observations. If it can be proved that this model applies equally to CYP and 3bHSD expressed in yeast as in COS1 cells then yeast would lend itself well to testing the hypothesis put forward in this thesis: that the control over steroidogenic flux lies in the supply of steroid precursor. This cross-species generalization would also strengthen the generality of the model and make it more applicable to the bovine adrenal, and eventually human physiology once the human genes are studied.
By constructing permanently transfected yeast strains, growing them up in culture to appropriate densities and then using them in experiments in non-growing medium where exact cell numbers are known (e.g. quantitated with a Coulter Counter) it would be possible to perform the needed experiments with greater accuracy and control. By saturating the experimental medium with cholesterol or pregnenolone it would be possible to simulate a constant supply of substrate needed for steady-state experimentation.
Such a system with 3bHSD in it would more accurately represent the topology of the steroidogenic pathway. In Figure 2.3 it can be seen that P5 is converted to both P4 and 17OHP5. The 17OHP5 is converted to 17OHP4 by 3bHSD. This source of 17OHP4 is not accounted for in the current model system and may significantly alter the control coefficient values shown in Table 5.2.
The V values obtained from the mixed experiments are under estimates of the true V values. Accurate V values are required for the reaction of P5 to P4, P5 to 17OHP5, 17OHP5 to 17OHP4, P4 to 17OHP4, P4 to DOC, 17OHP4 to S, DOC to corticosterone and S to cortisol. The employment of yeast to do this will give V values of conversion per time interval per yeast cell, a much finer measurement than conversion per time interval per slice of tissue culture dish.
The outlook for research in steroidogenesis employing the methodologies employed in this thesis is good.
Merck chemicals supplied thin Layer Chromatography (TLC) Plates (Cat#: 1.05554). Steroid preparations of P4, 17OHP4, DOC, and S (2 mg/mL 100% ethanol) were spotted onto the TLC plate and developed twice consecutively in two different solvent mixes. The TLC plate was first developed in a mixture of 99% chloroform (CHCl3) and 1% ethyl acetate (EtAct), dried under hot air and subsequently developed in a mixture of 99% methylene chloride (CH2Cl2) and 1% methanol (MeOH). A typical elution profile obtained is given in Figure A.1.
For the resolving of experimental samples the samples were spotted onto the plate in 0.8 to 1 cm wide lanes along with standards. The lanes were carved out with 1 mL plastic pipet tip without applying so much pressure so as to bend the plate. The TLC plates were then developed as described above. The steroids were resolved to a minimum inter-spot distance of 2 cm. The spots were excised for examination without the threat of cross contamination of steroid spots and samples.
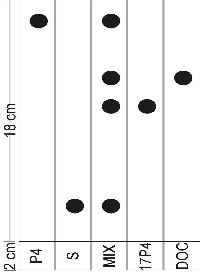
The steroid spots were cut from the TLC plate and placed in a scintillation vial with 8 ml scintillation fluid (Beckman, Ready Flo Scintillation fluid, cat# 586603). 1 cm of TLC plate was excised on either side of the spot to get as much of the radioactive steroid as possible so as to quantitatively compare radioactivity between TLC segments and ignore the different lateral and vertical diffusion of the spots. The samples were counted with a Beckman LS 3801 scintillation counter. Samples were counted for 10 minutes.
Steroids were separated by HPLC on a Novapak\circledR C18 reverse phase column with 65:35 MeOH:Water and 100% MeOH solvents. The elution gradient used is given in Table A.1.
| time (min) | % solvent A | % solvent B |
| 0.1 | 100% | 0% |
| 10.0 | 100% | 0% |
| 20.0 min | 0% | 100% |
| 30.0 min | 0% | 100% |
| 35.0 min | 100% | 0% |
Radioactive detection was by means of a Flo-one b-radioactive flow detector from Radiomatic fitted with a 500 mL detection cell using Beckman Ready Flo scintillation fluid (cat# 586603) was used. The radioactive detector was calibrated to filter out background noise.
Retention times of the steroids are given in Table .
| S | |
| 17OHP4 | |
| DOC | |
| P4 | 20 min |
Polyetheleneglycol precipitation of adrenal microsomes based on a protocol from Yan & Cederbaum [96].
Sheep adrenals were collected at Maitland Abattoir from freshly slaughtered sheep. The adrenals were stored in chilled (4°C) 1.15% KCl and kept on ice and later washed in said solution before the capsule was removed. At all times the adrenals were kept chilled on ice or in ice-water (4°C).
Refer to Fig A.2 for a diagramatic explanation of the protocol that follows.
The washed and prepared adrenals were placed in a buffer of 10 mM TRIS, 1.0 mM EDTA, 0.25 M sucrose, pH 7.4. 50 grams of adrenal was homogenized in the latter buffer in a Warring blender and Thomas teflon pestle tissue homogenizer attached to a Black & Decker Drill. The buffer to adrenal volume was 1:3 m/m. The homogenate was then centrifuged at 500×g for 10 minutes at 4°C. The resulting pellet was discarded.
The supernatant was centrifuged at 11'000×g for 16 minutes at 4°C. Again the pellet was discarded.
50% polyethelenglycol solution was added to the supernatant from the previous centrifuge step to a final polyethelenglycol concentration of 8.5%2. The solution was stirred at 4°C for 10 minutes. Thereafter the solution was centrifuged at 13'000×g for 20 minutes at 4°C to yield the adrenal microsome pellet.
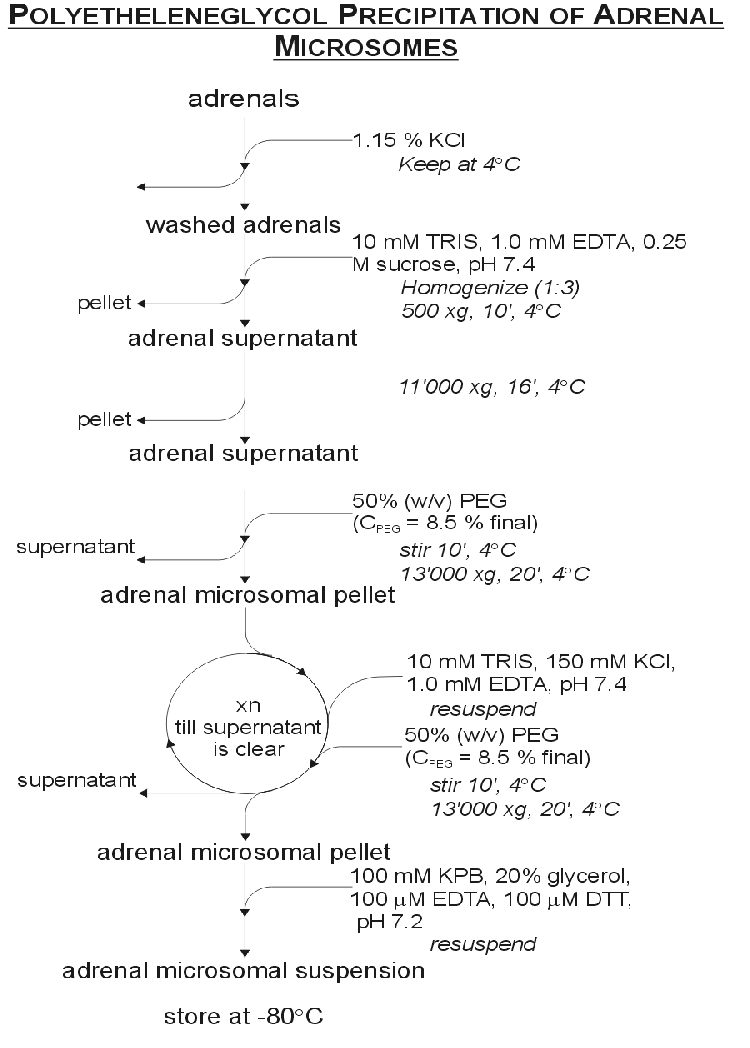
The pellet was resuspended in 10 mM TRIS, 150 mM KCl, 1.0 mM EDTA, pH 7.4 and again 50% polyetheleneglycol was added to a final concentration of 8.5%. The solution was stirred at 4°C for 10 minutes and then centrifuged at 13'000×g for 20 minutes at 4°C. This process of resuspention and centrifuging was repeated until the supernatant was clear. The clean pellet was then resuspended in a buffer of 100 mM Phosphate buffer, 20% glycerol, 100 mM DTT at pH 7.2. The microsomes were assayed for P450 concentration, aliquotted out and stored at -80°C for later use.
A volume of microsome suspension was diluted 10 times in 100 mM sodium phosphate buffer at pH 7.2 to a final volume of 2 mL. This volume was bubbled with carbon monoxide gas for 2 minutes at 1 bubble per second. 400 mL of this suspension was added to each of two cuvettes to which an additional 15 mL of 10 mM NADH was added. The tubes were inverted to mix the contents and then placed in the spectrophotometer. The machine was zeroed and a scan was carried out between 400 and 500 nm. The experiment cuvette was removed and 3 to 5 grains of sodium dithionate added. The tube was inverted to mix the contents. The reference cell was also inverted to counteract settling. Another scan was performed between 400 and 500 nm to yield the characteristic CO induced difference spectrum of reduced P450 in Fig 3.1 after ten minutes. Using the difference in amplitude between 450 and 490 nm the concentration of P450 was calculated using the extinction coefficient (e) of 92 mM-1.cm-1 (Abs=eL c).
Microsomal suspension was diluted to 10 mg/mL in microsomal resuspension buffer (see A.2.1). Quartz cuvettes were used for analysis. 1 mL suspension was added to each of the two cuvettes. The spectrophotometer was zeroed over a range of 350 to 500 nm with the equivalent 100% ethanol volume as would be if ethanol dissolved steroid were used.
In performing the scans steroid was added to the experiment cuvette and the equivalent volume of 100% ethanol to the reference cuvette and a scan performed from 350 to 500 nm. This yielded the scan given in Fig 3.4. The ethanol volume did not surpass 2% of the total volume.
2 mL test samples were prepared in test tubes before scanning with relevant reagents. For the experiment 1 mL of each was added to each cuvette where after the test steroid was added.
The difference between the 390 and 420 nm points was taken as the peak amplitude. These amplitudes were compared between samples.
Protein concentrations were determined with the BCA kit by Pierce (Cat# 23225) as per the manufacturers instructions. A BSA standard was prepared in the microsomal resuspension buffer. The samples were prepared in triplicate in a microtiter plate and read with a microtiter plate reader at 420 nm.
Steroid standards were made up in 100% ethanol to a concentration of 1 mg/ml. The standards were stored in dark bottles at -20°C.
Reactions were carried out in 20 mL glass test tubes at 37°C in a shaking water bath. The final reaction volume was 400 mL. Prior to beginning the experiment 5 mL CH2Cl2 was poured into 10 mL skrew-cap sample tubes. 450 mL of H2O was pipetted onto the CH42Cl2. These tubes were then chilled over night at 4°C.
P4 was blotted on to cellulose disks (\varnothing = 3mm). Enough cold P4 was blotted onto the disk to bring the final reaction concentration to 10 mM; in addition 100'000 counts per minute of radioactive P4 were blotted onto the disk. The disks were left to dry where after a volume of buffer (1% BSA, 50 mM NaCl, 50 mM Tris, pH 7.4) was added dependent on the volume of other reagents and microsomes. 4.4 mL of 100 mM MgCl2 and 4.2 mL of a 100 mM isocitrate solution was then added to the buffer and steroid. 6.44 mL isocitrate dehydrogenase (10.3 mg/mL protein, 6 units/mg protein) was added to the reaction mixture and then incubated at 37°C for 10 minutes. The tubes were gently shaken (150 rpm) in the water bath to facilitate mixing and gaseous exchange.
After 10 minutes a volume microsomal suspension was added dependent on the mM P450 required. The mixture was then incubated for a further five minutes at 37°C.
50 mL of the sample was drawn off and injected into the cold CH2Cl2/H2O mixture as a time zero where after 44 mL 10 mM NADPH was added to initiate the reaction. 50 mL samples were drawn off at regular intervals and added to the chilled CH2Cl2/H2O mixture and thoroughly mixed to stop the reaction.
The CH2Cl2/H2O extracts were spun down at maximum speed in a bench top centrifuge. The water was then aspirated off. A spatula tip of anhydrous Na2SO4 was added to each test tube. The samples were then spun down again as before and the supernatant decanted into disposable glass test tubes. The CH2Cl2 was evaporated under nitrogen gas. The dried samples were then ready for analysis by TLC. For HPLC analysis no Na2SO4 was added.
E. coli JM109 cells were revived from freezer stocks in 100 mL LB medium (1% bactopeptone, 0.5% yeast extract, 1% NaCl) overnight at 37°C. 1 mL of this overnight culture was used to inoculate a preheated 100 mL LB medium at 37°C. This culture was grown (± 2[ 1/2] hours) to an OD of 0.375 (measured at a wave length of 590 nm).
Freezer stocks were prepared from this overnight culture to a final glycerol concentration of 40% and stored at -80°C. The rest of the culture was spun down at 1'480×g for seven minutes at 4°C after incubating on ice for seven minutes. After centrifugation the supernatant was discarded and the pellet left to drip dry after which it was spun down as before and the remaining medium sucked off with a sterile pipet.
10 mL of chilled (4°C) 10 mM MgSO4 was added to the cell pellet to resuspend it. The cells were then spun down for 5 minutes at 4°C at 760×g. The supernatant was discarded and the pellet was left to drip dry where after 10 mL chilled 75 mM CaCl2 was added to the pellet and the cells resuspended.
The resuspended cells were incubated on ice (4°C) for 30 minutes and then spun down at 760×g, 4°C for five minutes. The supernatant was discarded and the gooey pellet resuspended in 2 mL 75 mM CaCl2 per original 50 mL of culture volume.
The competent cells were then stored at (4°C) until used for transformation or frozen at -80°C in 40% glycerol.
200 mL of competent cells were pipetted into a chilled sterile 14 mL Falcon\circledR Polypropylene Round-Bottom Tube. To this 50 ng of pCMVc17aBov, pCDc17aBov and pCMVc21y401 DNA was added to each separate transformation experimental tube. The pUC18 plasmid was used as a positive control. Competent cells and 5 mL sterile mQ H2O was used as a negative control. The tubes were gently agitated to facilitate mixing. The mixture was incubated for 30 minutes at 4°C.
Immediately after the incubation on ice the tubes were incubated at 42°C for exactly 90 seconds without any agitation. The cells were then promptly removed and put on ice for one to two minutes in which time 800 mL of SOC medium (2% bactotryptone; 0.5% yeast extract; 10 mM NaCl, MgCl2 MgSO4; 2.5 mM KCl; 20 mM dextrose, pH 7) was added. The tubes were then incubated at 37°C for 45 minutes.
After the incubation at 37°C, 100 mL of each tube was plated out on LB agar (LB medium with 5% bactoagar) with ampicillian (0.1 mg/mL). The plates were left at room temperature right side up till the liquid had been absorbed. After absorbtion the plates were inverted and incubated at 37°C for 12 to 16 hours where upon the plates were examined for colonies. The plates and colonies were then stored at 4°C for later use.
The Wizard Kit (Cat# A7100) by Promega was used as per instruction.
Large scale plasmid DNA was prepared with the Nucleobond Plasmid Preparation Kit (Cat# 740573). Bacterial cells and cell lysate were spun down in 50 mL polypropylene tubes. Mixing at the lysis step was done by gentle rolling. The column was eluted over a 10 mL polypropylene tube and then spun down after addition of the iso-propanol. The pellet was then redisolved in ethanol and pipetted into 1.5 mL eppendorf tube and spun down as per the supplied protocol to clean the pDNA pellet.
Large scale plasmid preparation was also performed using the alkaline-lysis protocol in Current Protocols [97] but the products not used.
Plasmid was analyzed by restriction enzyme digestions and electrophoresis through TAE (40 mM·Tris acetate, 2 mM EDTA pH 7) agarose gells.
The pCMVc17a and pCMVc21y401 were digested with Xba and EcoR1 as per the RE manufacturers instructions.
Near completion, the electrophoresis was stopped and the gel stained with ethidium bromide for 30 minutes. The gel was then again electrophoresed after being rinsed of the excess ethidium bromide. At completion the pDNA bands were visualized under ultra violet light and the gel photographed.
EcoR1 lyses the pCMVc17 plasmid twice, excising the fragment seen in the 3 pCMVc17 digest lanes. The three pCMVc21y401 digests show that pCMVc21y401 does not have a Xba site that generates a fragment of large enough size to be seen on the gel.
The digests and plasmids were run on a 1% molecular grade agarose gel in cold TAE buffer with l Marker III. Along with the isolated plasmids, standard plasmids were loaded in to adjacent lanes. The results are shown in Figure A.3. From the restriction fragment length analysis it can be seen that the pCMVc21y401 plasmids correspond to each other; as do the pCMVc17 plasmids. The pCDc17a plasmid is not shown as it was never used for any experiments.
All mediums and solutions were filtered with a 0.22 micron filter if they could not be autoclaved.
DMEM high glucose was purchased from Gibco BRL as 13.36 g bottles and made up in mQ H2O with 3.7 g sodium bicarbonate per liter. The PenStrep was purchased from Gibco BRL as 100 mL 5000 U.mL-1 mixtures. FCS was purchased as 100 mL bottles from Gibco BRL. 10 mL of the PenStrep and 100 mL of the FCS were added to the filtered DMEM medium after testing for contamination. Trypsin-EDTA media was bought as a 10× stock solution and diluted to the working solution with mQ H2O which was then filter sterilized, tested and frozen at -20°C.
Freezing medium was prepared as 10 mL aliquots consisting of 4 mL DMEM, 1 mL DMSO and 5 mL FCS. This medium was then filter sterilized and stored at -20°C . DMSO was purchased from Highvell Biologicals (Cat# 224).
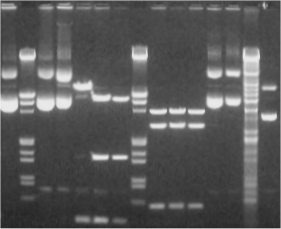
10 mL of 1 M Hepes was added to 500 mL DMEM (without FCS) for the preparation of Hepes-medium for transfection purposes. The 1 M Hepes buffer was prepared with Sigma Hepes salt in H2O with the pH adjusted to 7.4 and filter sterilized. The solution was aliquoted in 10 mL portions and stored at -20°C . 5 mL Pen-Strep was added and the medium tested and stored at 4°C. The DEAE-dextran was purchased from Sigma and made up to a concentration of 10 mg.mL-1 in 0.1 M Tris base pH 7.5 and filter sterilized. The solution was then stored at 4°C for a maximum of three months. The chloroquine was made up as 52 mg in 10 mL H2O, filter sterilized and aliquoted in 1 ml portions and frozen at -20°C.
COS1 cells were grown at 37°C, 5% CO2 and 90% humidity without exception. COS1 freezer stocks were maintained in liquid nitrogen in the freezing medium until needed and thawed.
The required number of freezer vials were taken from the liquid nitrogen and thawed at 37°C. The cells were resuspended in 1 mL culture media. The resuspended cells were added to 30 mL culture media in 50 mL falcon tube. The cells were dispersed by repeated drawing up and expelling of the medium with a sterile 10 mL glass pipette. The cells were then plated out in a 100 mm Corning tissue culture dish with 10 mL DMEM medium.
The cells were left to grow to confluency (3 days). At this stage the cells were split one dish to three.
In splitting the cells the culture medium was siphoned off with a sterile pasteur pipette. The dishes were washed with 1 mL 37°C Trypsin-EDTA and then siphoned again. 1 mL Trypsin-EDTA was added to the dishes and left to incubate under the tissue culture hood for three minutes. The cells were washed from the dish and dispersed by gently drawing up the Trypsin-EDTA medium with a 1 mL Gilson pipette with sterile filter tips and blasting the media on to the plate to dislodge the cells. This was repeated till all the cells were free. The cell suspension was then drawn up and added to 30 mL growing medium.
The cells were then plated out into three dishes as described above.
To transfect the cells were grown to 70% confluency and split one to six 24 hours before transfection.
The media was removed from the dish and the dish washed with Hepes Media (4 mL to a 100 mm dish and 2 mL to a 50 mm dish). The Hepes media was then removed. Transfection media was then added to the plates with the respective plasmid of choice. The transfection medium was composed of Hepes Medium with DEAE-dextran (25 mL 10 mg.mL-1 per mL medium). After the addition of the DEAE-dextran the plasmid was added to the transfection media to a final concentration of 5 mg pDNA.mL-1. 2 mL of transfection media was added to the 100 mm dishes (and 1.2 mL to the 50 mm dishes). The cells were left to incubate for one hour in the transfection medium.
After one hour the transfection media was drawn off and 10 mL chloroquine media was then added (5 mL for a 50 mm dish). This media was composed of DMEM media with 100 mL of 5.2 mg.mL-1 Chloroquine stock solution per 100 mL of medium. The cells were incubated in this media for five hours where after the chloroquine media was drawn off and 10 mL DMEM media added.
Transfected cells were left to grow for 72 hours before the experiment was initiated.
When the cells were confluent the media was drawn off and the dish washed with Trypsin-EDTA. The cells were dislodged and resuspended as described in section A.4.3. The 50 mL Falcon tubes were then spun down at 1'200 rpm for five minutes.
The supernatant was drawn off and the cell pellet resuspended in 3 mL freezing media per dish of culture. The freezing media/cell suspension was then aliquoted out into a 2 mL cryo-vial in 1 mL portions.
The cells, in freezing media, were stored for 48 hours in a styrofoam casing at -80°C before being moved to the liquid nitrogen for long term storage.
The ``pie'' slices were prepared from Corning 100 mm tissue culture dishes (Cat# 25020) by the Stellenbosch Physics Workshop (Figure A.4). The new radius of the slices was 40 mm and one slice represented 11% of a full dish ( » 1/8th of a full dish). Quarter slices were prepared but found inadequate for experimentation. The slices were packed eight slices per complete dish and sterilized by gamma irradiation. The slices could only be used once.
On the day of use fresh 2% agar was prepared (20 mL is adequate for six dishes) and autoclaved with a magnetic stirrer bar. After autoclaving, the agar was kept warm/fluid on a combination hot plate/magnetic stirrer. The agar was applied slice by slice with an autoclaved pasteur pipette and ethanol sterilized rubber teat. Enough agar was applied to the plate to line the base of one slice at a time. With flame sterilized curved tweazers the slices were pressed into the fluid agar.
The agar was left to set in the sterile hood before the suspended cells were added.
For transfection, 4 mL of transfection medium was used.
For the assay (see section A.5), the slices were removed from the dishes with sterile curved tweazers and placed in a new cutlure dish and 10 mL of DMEM medium3.
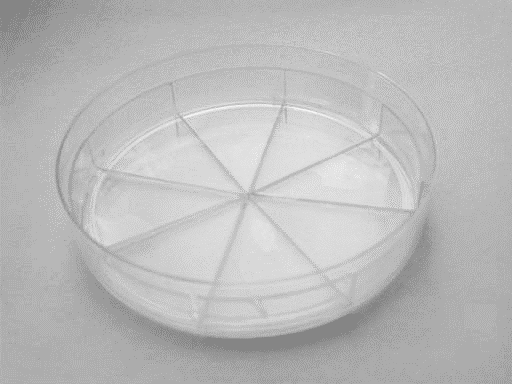
72 hours after transfection the the assay was initiated. 190'000 cpm of tritiated steroid was used per mL. The final concentration of non-tritiated steroid was 1 mM. The steroids were mixed into DMEM medium in an autoclaved schott bottle marked to the level of the volume media needed. The steroids were mixed by gentle inverting to avoid shaking the medium and causing it to foam. 10 mL4 of medium was added to each experimental plate where the pie slices were involved.
A 500 mL time zero sample was take from each dish at the beginning of the experiment. Additional 500 mL samples were drawn off with sterile filter tips are regular intervals.
Samples were collected in 10 mL screw cap glass tubes with 5 mL CH2Cl2. No water was added to the sample vial as described for the microsomal steroid conversion assay.
Samples were processed as in section A.2.6. The tubes were left to warm up before processing.
After the experiment the medium was drawn off and the dishes washed with PBS (137 mM NaCl, 2.7 mM KCl, 4.3 mM Na2HPO4, 1.4 mM KH2PO4, pH 7.3). The cells were removed from the washed dishes/slices by scraping with a stiff piece of plastic. The cells were resuspended in 10 mL PBS and then spun down at 1'200 rpm for five minutes. The pellet was then resuspended in 1 mL PBS and frozen until the protein concentration was to be determined.
The cells were homogenized with a glass mortar and pestel homogenizer. The homogenization process was helped by the freezing/thawing process.
The protein was quantitated as in Section A.2.4. BSA standards were prepared in PBS.
1In Control Analysis terminology concentration is denoted as the symbol of the variable or parameter in lower case and italics in conjunction with the subscript number of the step. e2 is therefore the concentration of enzyme (e) number 2.
2V50% m/VPEG=0.186×Vsupernatant
3This volume was found to be too low and 20 mL is suggested for future use.
4This volume was found to be too low
and 20 mL is suggested for future use.