My thesis topic was to study the control of metabolite flux through the CYP17-CYP21 branch point of adreanl steroidogensis. The complete thesis can be downloaded here as a 2515 kb PDF file.
Of interest are the steroid products aldosterone and cortisol which have very different (and antagonistic) actions but are produced by the same metabolic pathway. They are regulated independently and very strictly.
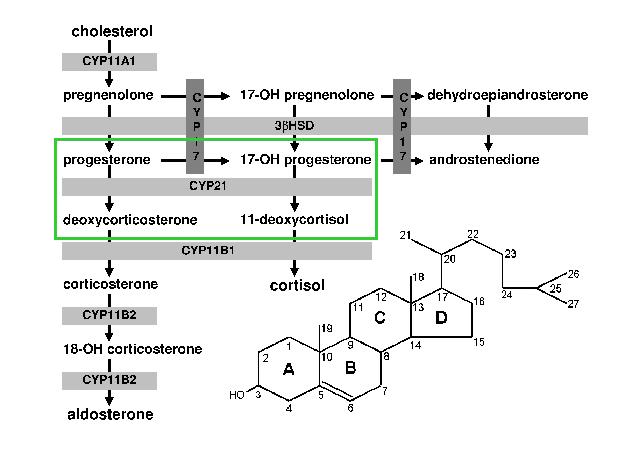
The schematic below is a representation of adrenal steroid metabolism beginning with cholesterol and terminating at androstenedione. The reactions catalyzed by CYP11A1, CYP11B1 CYP11B2 occur in the mitochondria. All other reactions occur in the endoplasmic reticulum. The inset is the numbered structure of cholesterol. The CYP11A1 reaction cleaves off carbons 22 to 27. The green block indicates the specific part of the pathway under investigation.
Steroid production is divided between three tissues that employ segments of the same pathway as shown in the following picture. Each box represents a primary steroid product associated with a particular adrenal cortex zone. The reactions outside the boxes occur in all three tissues. Each arrow head denotes a reaction step. Only beginning, end and branch point metabolites are shown for brevity.
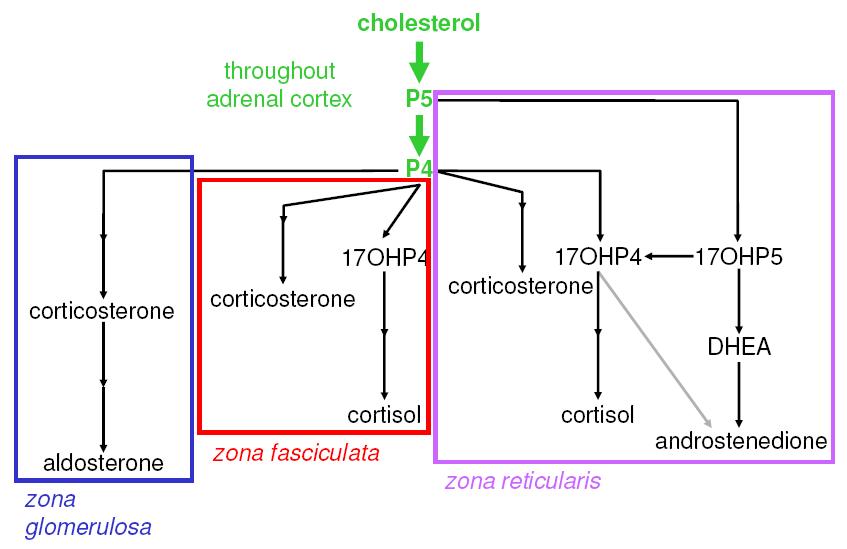
From the picture it is clear that the real topic is metabolism of steroids in the zona fasciculata, also that the concentration of cortisol will depend entirely on the activity of CYP17, and hence CYP17 will possess 100% the control over the flux through this portion of the pathway... This was obvious from the information already available but someone thought this issue needed more thought. To say anything new about this the investigation was widened a bit and the section of pathway reformed and turned into a mathematical model.
The maths is very simple. The measure flux (J) is defined as the amount of metabolite passing though a step in a pathway during steady-state (where as much is produced as is removed) per second. The measure of control (C) over flux is calculated as the change in flux per change in enzyme concentration (v, as the concentration of enzyme can be reduced to its effect maximal rate of activity... read the thesis to understand why).
The above diagrams, for mathematical clarity is redrawn as follows: the steady-state reaction scheme with P4 supply and S/DOC demand.

In the above reaction scheme X0 represents P5; S1, P4; S2, 17OHP4; S3, S; X5, cortisol; S4, DOC; and X6, corticosterone. R1 (Reaction 1) is a supply block; R2 is catalyzed by CYP17, R3 and R5 by CYP21; and R4 and R6 by CYP11B1. Substrate inhibitions are indicated with dashed lines. The flux through the pathway can be divided up into three sections: Ja (J1), Jb (J2,3,4) and Jc (J5,6) where Ja = Jb +Jc.
Now the question is asked, just how does the value of 11-deoxycortisol (S, or S3 in the model) and deoxycorticosterone (DOC or S4) change in respect to a change in the concentration of CYP17 or the increase in P5 (pregnenolone, X0 in the model).
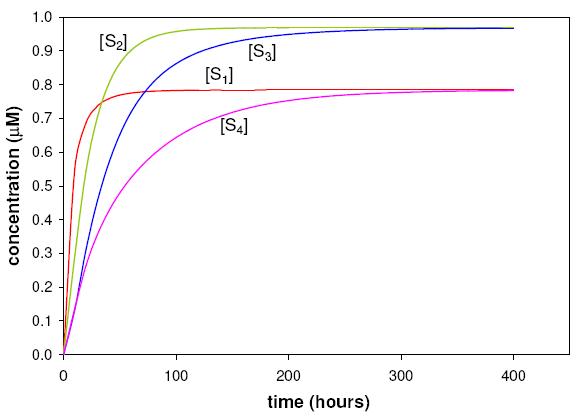
The computer model produced a metabolite profile as follows:
Varying the activities of the enzymes can yield differences of several 100 which would be very difficult to show on such a nice graph as above. Also, as very BIG changes can be made to the enzyme concentrations, changes that look significant are actually not. For this reason the data is converted to the logarithmic scale where values are represented as percentage changes. This is also has a tendency of producing what look like lovely straight lines with which it is easy to see differences.
Of the course the big question about now is just how reliable is the model? Experiment were performed where the amount of enzyme was varied. How well does the model fit experiment? Well, there was a 99% correlation between the model and the experiments. Go read the thesis for a detailed explanation of how the model was made and tested.
The first computer experiment was to change the amount of X0 entering the system.
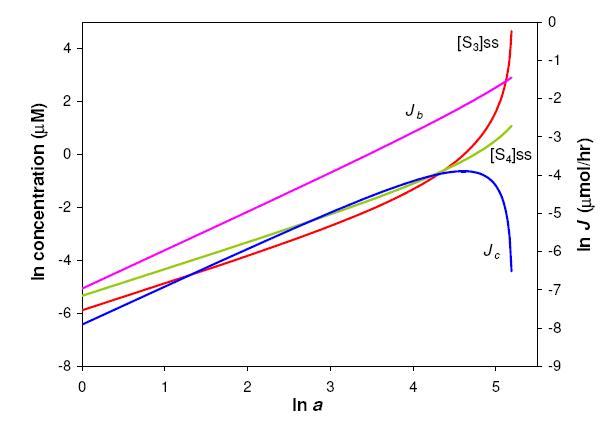
Steady-state plot with E1 a varied from 1 to 200. x0 is constant at 1 µM; and x5 and x6 constant at 0. The value of a for reaction 1 is varied from 1 to 200. All other values of a are maintained at 100. No steady-state was found at a > 180. There is a 36× difference between s3 and s4 at 180.
The next experiment was the change the activity of CYP17, enzyme 2, in the pathway.
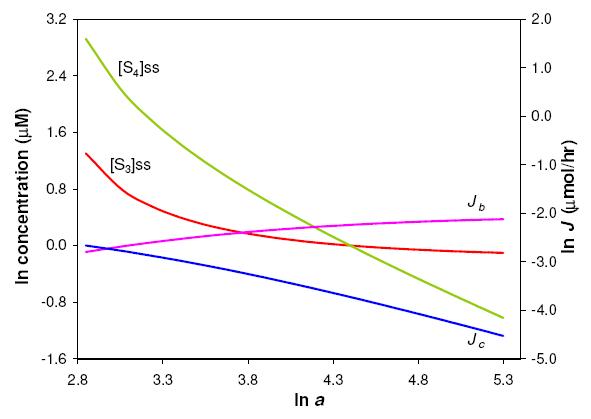
Steady-state plot with E2 a varied from 1 to 200. x0 is constant at 1 µM; and x5 and x6 constant at 0. The value of a for reaction 2 is varied from 1 to 200. All other values of a are maintained at 100. No steady-state was found at values of a < 17. There is a 251× difference between s3 and s4 at a = 200.
While one may think the latter is more significant it is not. The former experiment is more important. It is not the end concentration that is as important as the flux through the system. With the first experiment the flux through the pathway producing deoxy-corticosterone (which becomes aldosterone, the antagonist of cortisol) falls to zero meaning none of it is made at all. As even a little steroid is effective, you do not need as much a big difference in steroid concentration as much as you need to have as little as possible of the one to get the most from the other.
So, when you body want to prepare you for stressful conditions it flood the pathway with pregnenolone which pretty much turns off aldosterone production and increases cortisol production so that it will have a larger effect on your body.